You should spend about 20 minutes on this task.
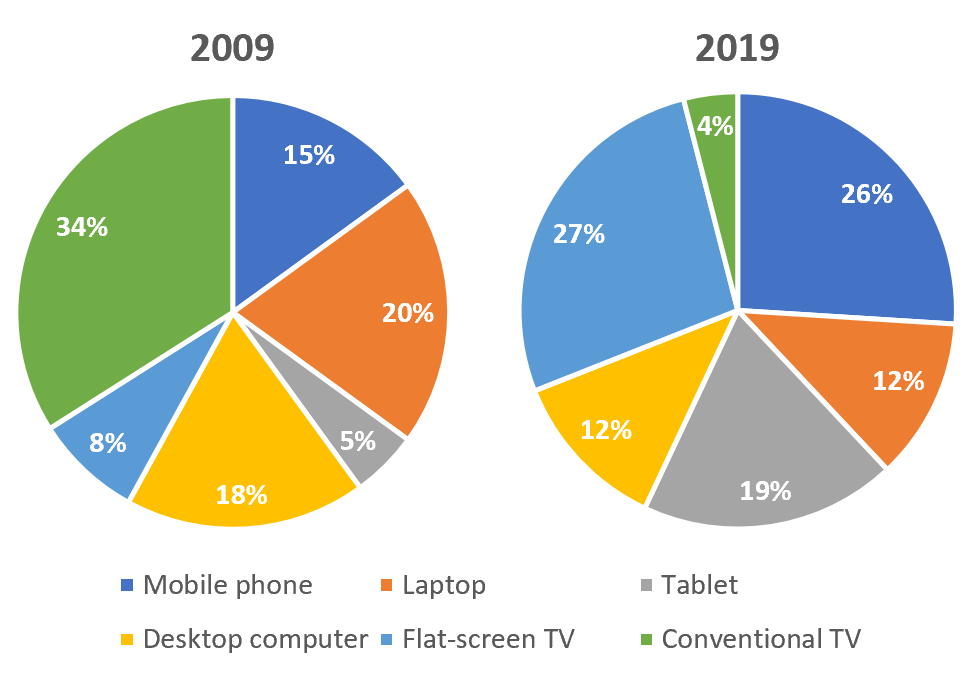
The pie charts below show the devices people in the 18 to 25 age group use to watch television in Canada in two different years.

Summarise the information by selecting and reporting the main features, and make comparisons where relevant.
Write at least 150 words.
Sample Answer 1
The two charts illustrate the appliances young adults in Canada use to watch television programmes and how this changed from 2009 to 2019. One of the fundamental changes over this decade is the transition from conventional televisions to flat screens, with the former falling from 34% to 4% and the latter rising from 8% to 27% for the period, making it the number one television device. The latter has replaced the former as the most popular TV viewing device.
Another general trend is that younger people now watch television on smaller, more portable devices than in 2009. In particular, the use of mobile phones and tablets for viewing purposes has increased by almost three quarters to 26% and tablet use seeing an almost four-fold increase to 19%. This trend is reinforced by the number of 18 to 25-year-olds using computers for TV viewing. Both desktop and laptop computers saw substantial falls in usage (around a third for both).
Overall, it can be said that the two pie charts suggest the TV viewing habits in Canada over the period saw a move away from older devices and towards more modern equivalents.
Sample Answer 2
The two graphs show how the equipment used by young adults in Canada to view television shows has changed from 2009 to 2019.
Overall, the two pie charts show that TV viewing patterns in Canada have shifted away from older devices and toward more modern alternatives over time.
The switch from traditional televisions to flat displays has been one of the most significant transformations in this decade. The former dropped from 34% to 4% for the period, while the latter increased from 8% to 27%, making it the most popular television device. The latter has supplanted the former as the most widely used television viewing device.
Another general tendency is that, in comparison to 2009, younger people increasingly watch television on smaller, more portable devices. In particular, the usage of mobile phones and tablets for watching purposes has surged by nearly three-quarters to 26%, with tablet use increasing by almost four-fold to 19%. The amount of 18 to 25-year-olds who watch TV on laptops supports this trend. The use of desktop and laptop computers has decreased significantly (around a third for both).
Sample Answer 3
The two graphs show which devices young adults in Canada use to watch television and how this has progressed over the 10 years, from 2009 to 2019. One of the most significant shifts over the last decade has been the shift from traditional televisions to flat screens, with the former declining from 34% to 4% and the latter jumping from 8% to 27% during the same period, making it the most popular television device. The latter has surpassed the former as the most widely used TV viewing device.
Another general tendency is that, compared to 2009, young folks are now watching tv on smaller, more handheld devices. In particular, the usage of mobile phones and tablets for watching has surged by nearly three-quarters to 26 percent, with tablet use increasing nearly fourfold to 19 percent. This tendency is bolstered by the number of 18 to 25-year-olds who watch TV on laptops. Both desktop and laptop computers decreased significantly (around a third for both).
However, the two pie charts indicate that TV viewing preferences in Canada have shifted away from older gadgets and toward more recent equivalents over the period.
Sample Answer 4
The two charts illustrate 6 types of appliances people aged 18 to 25 in Canada utilized to watch television in 2019 and 2019.
Overall, it can be seen that the use of traditional TV sets, laptops and desktop computers decreased significantly while the new technological gadgets gained popularity as television viewing devices.
The ten-year period from 2009 witnessed a sharp decline in conventional TV for viewing purposes from 34% to 4%. Laptop and desktop computers experienced the same pattern in which the figures for the former fell from almost a fifth to 12%, and the number of the latter shrank by one-third from 18% to 12%.
On the other hand, there was a dramatic growth in modern devices used by Canadians for watching television. Flat-screen TV jumped from 8% in 2019 to over a fourth, making it the top device in terms of television viewing. Increasingly favoured by young Canadians, cell phones rocketed from 15% to 26%, and tablets underwent an almost four-fold increase to 19% in 2019.
