• E-mail: [email protected]
  • Listening
    • Cambridge IELTS Tests
    • IELTS Practice Tests
    • Recent Actual Tests
  • Reading
    • Cambridge IELTS Tests
    • IELTS Practice Tests
    • Recent Actual Tests
  • Speaking
    • Speaking Part 1
    • Speaking Part 2
    • Speaking Part 3
  • Writing
    • General Training Writing Task 1
    • Academic Writing Task 1
      • Bar Chart
      • Line Graph
      • Pie Chart
      • Table
      • Map
      • Process Diagram
      • Mixed Charts
    • IELTS Writing Task 2
      • Advantages & Disadvantages Essays
      • Agree or Disagree Essays
      • Discuss Both Views Essays
      • Direct Questions Essays
      • Problems/Causes & Solutions Essays
  • Grammar
  • Vocabulary
    • Speaking Vocabulary
    • Writing Vocabulary
    • Collocation for IELTS
  • IELTS Books
  • Blog
No Result
View All Result
No Result
View All Result
Home IELTS Writing

Average monthly temperatures and the average number of hours of sunshine

9IELTS by 9IELTS
October 14, 2022
in IELTS Writing, Academic Writing Task 1, Line Graph
Reading Time: 2 mins read
8
VIEWS

» You should spend about 20 minutes on this task.

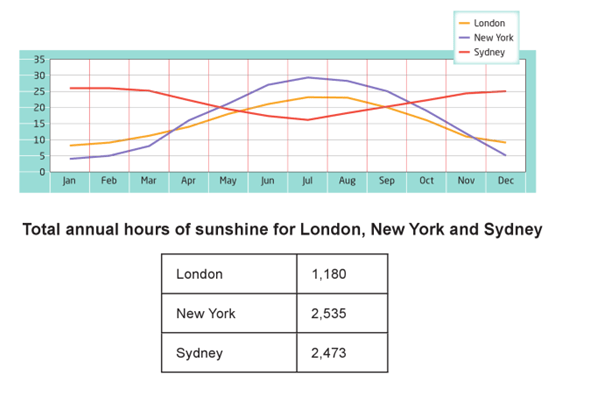
The graph and table below show the average monthly temperatures and the average number of hours of sunshine per year in three major cities. Summarise the information by selecting and reporting the main features and make comparisons where relevant.

» Write at least 150 words.

Average monthly temperatures and the average number of hours of sunshine

Sample Answer


The line graph illustrates the mean temperature per month, whereas the table demonstrates the hours of sunshine in average in a year in London, New York and Sydney. Overall, it is clear that although London and New York become warmer but the temperatures start to decrease near the end of the year, the opposite trend is true for Sydney.

In January, the temperature in London is higher than New York with figures 8 and around 5 respectively. As the temperatures in both cities continue to rise, the temperature in New York becomes higher than London in middle of March; the figures go up gradually and reach peaks in July (just under 30 and around 23) before showing a downward trend until December with a lower temperature in New York than in London.

Turning to Sydney, the temperature starts to decline from January to July and then rises back in the end of the year with the lowest point just above 15. From the table, it is observed that New York has the highest number of hours exposed to the sunshine (2535 hours) and that was slightly higher than that of Sydney (2473 hours). Total hours of sunshine in London was the least and that was 1180 hours.

[ Written by – Lee Wing Qeen ]

Previous Post

Some people think that foreign visitors should be charged more

Next Post

Television cannot replace the book as a learning tool

Leave a Reply

Your email address will not be published. Required fields are marked *

POPULAR POSTS

IELTS Reading Practice Test 47

IELTS Reading Practice Test 151

IELTS Reading Practice Test 40

Modern technology is creating a single world culture

Advantages and disadvantages of leaving country to live or study abroad

The average number of hours each day that Chinese American Turkish and Brazilian tourists

Global warming is the most pressing environmental problem

Education standards have declined in recent times

The typical stages of consumer goods manufacturing

Many criminals commit crimes after they were set free

About Us

9IELTS

9IELTS is dedicated to providing free materials and resources for IELTS conquerors. Stay constantly updated with a wide range of ultimate tips, strategies, and practice tests to crack the high-stakes IELTS exam!

Recent Posts

Describe a friend you like to spend time with

IELTS Listening Practice Test 193

IELTS Speaking Part 1: Handwriting

IELTS Listening Practice Test 131

Describe a neighbour who helps other people

Disclaimer

The information on this site is for informational purposes only. IELTS is a registered trademark of the University of Cambridge ESOL, the British Council, and IDP Education Australia. This site and its owner are not affiliated, approved or endorsed by University of Cambridge ESOL, the British Council, or IDP Education Australia.
  • About Us
  • Contact Us
  • Disclaimer
  • Terms & Conditions
  • Privacy Policy

Copyright © 2023 9IELTS. All Rights Reserved.

No Result
View All Result
  • Listening
    • Cambridge IELTS Tests
    • IELTS Practice Tests
    • Recent Actual Tests
  • Reading
    • Cambridge IELTS Tests
    • IELTS Practice Tests
    • Recent Actual Tests
  • Speaking
    • Speaking Part 1
    • Speaking Part 2
    • Speaking Part 3
  • Writing
    • General Training Writing Task 1
    • Academic Writing Task 1
      • Bar Chart
      • Line Graph
      • Pie Chart
      • Table
      • Map
      • Process Diagram
      • Mixed Charts
    • IELTS Writing Task 2
      • Advantages & Disadvantages Essays
      • Agree or Disagree Essays
      • Discuss Both Views Essays
      • Direct Questions Essays
      • Problems/Causes & Solutions Essays
  • Grammar
  • Vocabulary
    • Speaking Vocabulary
    • Writing Vocabulary
    • Collocation for IELTS
  • IELTS Books
  • Blog

Copyright © 2023 9IELTS. All Rights Reserved.

This site uses cookies to offer you a better browsing experience. By continuing to use this website, you agree to our Privacy Policy.