• E-mail: [email protected]
  • Listening
    • Cambridge IELTS Tests
    • IELTS Practice Tests
    • Recent Actual Tests
  • Reading
    • Cambridge IELTS Tests
    • IELTS Practice Tests
    • Recent Actual Tests
  • Speaking
    • Speaking Part 1
    • Speaking Part 2
    • Speaking Part 3
  • Writing
    • General Training Writing Task 1
    • Academic Writing Task 1
      • Bar Chart
      • Line Graph
      • Pie Chart
      • Table
      • Map
      • Process Diagram
      • Mixed Charts
    • IELTS Writing Task 2
      • Advantages & Disadvantages Essays
      • Agree or Disagree Essays
      • Discuss Both Views Essays
      • Direct Questions Essays
      • Problems/Causes & Solutions Essays
  • Grammar
  • Vocabulary
    • Speaking Vocabulary
    • Writing Vocabulary
    • Collocation for IELTS
  • IELTS Books
  • Blog
No Result
View All Result
No Result
View All Result
Home IELTS Writing

Change in share of international students among university graduates

9IELTS by 9IELTS
October 14, 2022
in IELTS Writing, Academic Writing Task 1, Bar Chart
Reading Time: 2 mins read
8
VIEWS

» You should spend about 20 minutes on this task.

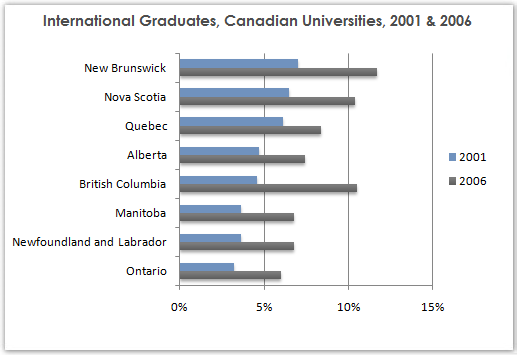
The chart below shows the percentage change in the share of international students among university graduates in different Canadian provinces between 2001 and 2006.Summarise the information by selecting and reporting the main features, and make comparisons where relevant.

» Write at least 150 words.

Change in share of international students among university graduates

Sample Answer


The bar graph shows data for international students in eight different provinces of Canadian Universities between 2001 and 2006. As is presented in the graph, the percentage of international students among those provinces increased significantly.

According to the given data, New Brunswick had nearly 7% share of international students in 2001 which was the largest percentage. In this year, Nova Scotia and Quebec both had more than 5% share of international students. All other provinces listed in the graph had less than 5% share of those international students.

After 5 years in 2006, the percentages of international students in these provinces increased significantly and New Brunswick had the highest percentage of international students (about 12%) while Nova Scotia and British Columbia both had over 10% such students. The percentage of international students in all other provinces increased noticeably and these shares were between 6% – 8%.

In summary, more international students went to study in Canadian Universities in 2006 than 2001, and New Brunswick and British Columbia were the two most favourite provinces for them in 2006.

Previous Post

Less and less people nowadays go to cinema to watch movies

Next Post

International air travel has a negative impact upon the environment

Leave a Reply

Your email address will not be published. Required fields are marked *

POPULAR POSTS

Supermarkets should only sell food produced from within their own country

Describe an interesting lesson that you attended

Describe a short term goal or ambition you have

Describe One of the Happiest Travels You Ever Had

IELTS Listening Practice Test 189

Social and economic indicators for four countries in 1994

In the future we will have more and more leisure time

The amount of leisure time enjoyed by men and women of different employment status

Describe a teacher from the past whom you remember

Nowadays, more and more people from different cities are spending more time away from their families

About Us

9IELTS

9IELTS is dedicated to providing free materials and resources for IELTS conquerors. Stay constantly updated with a wide range of ultimate tips, strategies, and practice tests to crack the high-stakes IELTS exam!

Recent Posts

IELTS Reading Practice Test 148

Organic fruits and vegetables are more expensive

Art should be better funded by the government but there must be more control

The diagram shows the life cycle of a honey bee

Describe a typical day in your life when you were a child

Disclaimer

The information on this site is for informational purposes only. IELTS is a registered trademark of the University of Cambridge ESOL, the British Council, and IDP Education Australia. This site and its owner are not affiliated, approved or endorsed by University of Cambridge ESOL, the British Council, or IDP Education Australia.
  • About Us
  • Contact Us
  • Disclaimer
  • Terms & Conditions
  • Privacy Policy

Copyright © 2023 9IELTS. All Rights Reserved.

No Result
View All Result
  • Listening
    • Cambridge IELTS Tests
    • IELTS Practice Tests
    • Recent Actual Tests
  • Reading
    • Cambridge IELTS Tests
    • IELTS Practice Tests
    • Recent Actual Tests
  • Speaking
    • Speaking Part 1
    • Speaking Part 2
    • Speaking Part 3
  • Writing
    • General Training Writing Task 1
    • Academic Writing Task 1
      • Bar Chart
      • Line Graph
      • Pie Chart
      • Table
      • Map
      • Process Diagram
      • Mixed Charts
    • IELTS Writing Task 2
      • Advantages & Disadvantages Essays
      • Agree or Disagree Essays
      • Discuss Both Views Essays
      • Direct Questions Essays
      • Problems/Causes & Solutions Essays
  • Grammar
  • Vocabulary
    • Speaking Vocabulary
    • Writing Vocabulary
    • Collocation for IELTS
  • IELTS Books
  • Blog

Copyright © 2023 9IELTS. All Rights Reserved.

This site uses cookies to offer you a better browsing experience. By continuing to use this website, you agree to our Privacy Policy.