• E-mail: admin@9ielts.com
  • Listening
    • IELTS Practice Tests
    • Recent Actual Tests
  • Reading
    • IELTS Practice Tests
    • Recent Actual Tests
  • Speaking
    • Speaking Part 1
    • Speaking Part 2
    • Speaking Part 3
  • Writing
    • General Training Writing Task 1
    • Academic Writing Task 1
      • Bar Chart
      • Line Graph
      • Pie Chart
      • Table
      • Map
      • Process Diagram
      • Mixed Charts
    • IELTS Writing Task 2
      • Advantages & Disadvantages Essays
      • Agree or Disagree Essays
      • Discuss Both Views Essays
      • Direct Questions Essays
      • Problems/Causes & Solutions Essays
  • Grammar
  • Vocabulary
    • Speaking Vocabulary
    • Writing Vocabulary
    • Collocations for IELTS
  • Books
  • Blog
No Result
View All Result
No Result
View All Result
Home IELTS Writing

Changes in three areas of crime in New Port city

9IELTS by 9IELTS
July 18, 2022
in IELTS Writing, Academic Writing Task 1, Line Graph
Reading Time: 3 mins read
52
VIEWS

» You should spend about 20 minutes on this task.

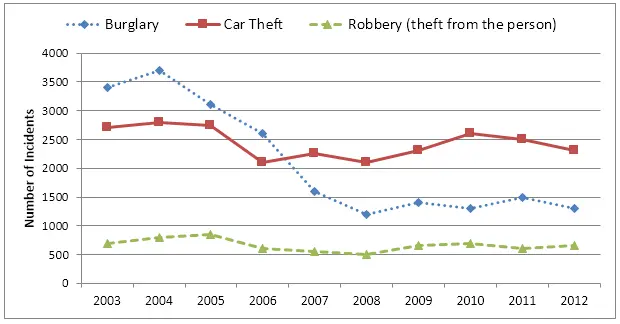
The chart below shows the changes that took place in three different areas of crime in New Port city center from 2003-2012. Summarise the information by selecting and reporting the main features, and make comparisons where relevant.

» Write at least 150 words.

  The changing rates of crime in the New Port city from 2003-2012

Changes in three areas of crime in New Port city

Sample Answer 1

The graph represents the variation in levels in the three main areas of crime in the centre of Newport city in the time period from 2003 to 2012.

To start with, it was 3400 incidences of burglary in 2003 and 3750 in 2004. Fortunately, it fell dramatically in the next 4 years and reached the absolute minimum in 2008 (1100 incidences). However, it then grew by 300 accidents and remained fairly constant by 2012.

Car theft was a steady level of crime from 2003 to 2004 and reduced in the next 5 years from 2700 to 2250. The number then increased to 2700 in 2012. Robbery reached its peak in 2005, which was 900 cases, and decreased to 500 in 2008. In the following two years, the number of incidences rose to 700 and stayed at this level in 2012.

In conclusion, in the Newport city centre, the burglary rate fell significantly, and the level of robbery remained fairly constant. In contrast, car theft raised and had the biggest number of incidences in 2012.

Sample Answer 2

The line graphs illustrate the variation of three types of crimes in Newport city centre over a 10-year period. In general, almost every crime rate fluctuated over the given period of time except burglary, which showed an overall downward trend.

Initially, in 2003, there were more cases of burglary (approximately 3400) than car theft (roughly 2800) and robbery (just above 500). Over time, there were always more car theft incidents than robberies. In contrast, the number of incidents of burglary was higher than that of car theft from 2003 to 2006, and there was an equal in the number of cases of burglary and car theft in the middle of the year 2006. From 2007 onwards, there were more cases of car theft than burglary, which is followed by robbery.

There was a sharp dip in the number of car theft incidents in 2006 (around 2100) before it continued to rise until 2012. The number of burglary and robbery occurrences reached their lowest points in 2008, with figures just above 1000 and 500, respectively.

Sample Answer 3

This graph illustrates how crime rates altered in Panama City from 2010-2019. We can see immediately that the greatest change occurred in the number of burglaries, while incidents of theft remained low but steady.

In 2010, we can see that burglary was the most common crime, with approximately 3,400 reported cases. The figure rose to around 3,700 in 2011, but then there was a downward trend until 2015. At this point, the figure stood at just over 1,000 incidents. This rose slightly in 2016, then fluctuated for the remaining period.

In 2010, the number of stolen cars stood at around 2,800 and followed a similar trend to burglary until 2013. At this point, the number rose to around 2,200 in 2014. There was a marginal decrease in the following year, but from then on, the trend was generally upwards.

Finally, robbery has always been a fairly minor problem for Panama City. The number of offences committed changed a little over nine years. It is interesting to note that the figure of approximately 700 in 2010 is the same figure for 2019.

Previous Post

Complaints made about noise to Environmental Health authorities

Next Post

Technology affected the types of relationships people make

Leave a Reply Cancel reply

Your email address will not be published. Required fields are marked *

POPULAR POSTS

Cambridge IELTS 1-19 Book Series [PDF + Audio]

Cambridge IELTS 20 Academic [Update 2025]

Cambridge IELTS 19 Academic [PDF + Audio]

200 IELTS Speaking Sample Answers [PDF + Audio]

Cambridge IELTS 18 Academic [PDF + Audio]

IELTS Recent Actual Tests [Full PDF + Audio]

IELTS Listening Practice Test 204

IELTS Reading Practice Test 320

Cambridge IELTS 18 General Training [PDF + Audio]

Cambridge IELTS 17 General Training [PDF + Audio]

About Us

9ielts logo

9IELTS is dedicated to providing free materials and resources for IELTS conquerors. Stay constantly updated with a wide range of ultimate tips, strategies, and practice tests to crack the high-stakes IELTS exam!

Recent Posts

Overpopulation in most developing countries is a problem

Exercise is the key to health while others feel that having a balanced diet is more important

IELTS Reading Practice Test 280

Television has changed the quality of life for the ordinary person

Describe one of your relatives whom you like

Disclaimer

The information on this site is for informational purposes only. IELTS is a registered trademark of the University of Cambridge ESOL, the British Council, and IDP Education Australia. This site and its owners are not affiliated, approved or endorsed by University of Cambridge ESOL, the British Council, or IDP Education Australia.
  • About Us
  • Contact Us
  • Disclaimer
  • Terms & Conditions
  • Privacy Policy

© 2024 9IELTS. All Rights Reserved.

No Result
View All Result
  • Listening
    • IELTS Practice Tests
    • Recent Actual Tests
  • Reading
    • IELTS Practice Tests
    • Recent Actual Tests
  • Speaking
    • Speaking Part 1
    • Speaking Part 2
    • Speaking Part 3
  • Writing
    • General Training Writing Task 1
    • Academic Writing Task 1
      • Bar Chart
      • Line Graph
      • Pie Chart
      • Table
      • Map
      • Process Diagram
      • Mixed Charts
    • IELTS Writing Task 2
      • Advantages & Disadvantages Essays
      • Agree or Disagree Essays
      • Discuss Both Views Essays
      • Direct Questions Essays
      • Problems/Causes & Solutions Essays
  • Grammar
  • Vocabulary
    • Speaking Vocabulary
    • Writing Vocabulary
    • Collocations for IELTS
  • Books
  • Blog

© 2024 9IELTS. All Rights Reserved.