• E-mail: admin@9ielts.com
  • Listening
    • IELTS Practice Tests
    • Recent Actual Tests
  • Reading
    • IELTS Practice Tests
    • Recent Actual Tests
  • Speaking
    • Speaking Part 1
    • Speaking Part 2
    • Speaking Part 3
  • Writing
    • General Training Writing Task 1
    • Academic Writing Task 1
      • Bar Chart
      • Line Graph
      • Pie Chart
      • Table
      • Map
      • Process Diagram
      • Mixed Charts
    • IELTS Writing Task 2
      • Advantages & Disadvantages Essays
      • Agree or Disagree Essays
      • Discuss Both Views Essays
      • Direct Questions Essays
      • Problems/Causes & Solutions Essays
  • Grammar
  • Vocabulary
    • Speaking Vocabulary
    • Writing Vocabulary
    • Collocations for IELTS
  • Books
  • Blog
No Result
View All Result
No Result
View All Result
Home IELTS Writing

Consumption of energy in the USA since 1980 with projections

9IELTS by 9IELTS
July 18, 2022
in IELTS Writing, Academic Writing Task 1, Line Graph
Reading Time: 3 mins read
5
VIEWS

» You should spend about 20 minutes on this task.

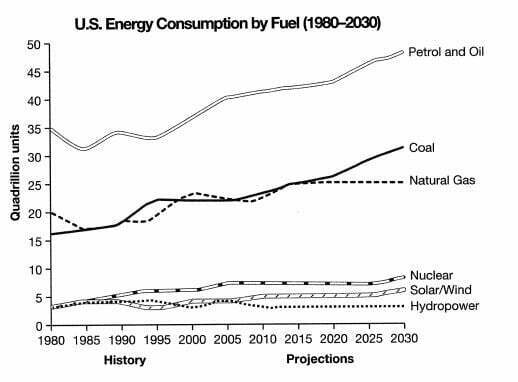
The graph below gives information from a 2008 report about consumption of energy in the USA since 1980 with projections until 2030.Summarise the information by selecting and reporting the main features, and make comparisons where relevant.

» You should write at least 150 words.

Consumption of energy in the USA since 1980 with projections
Academic IELTS Writing task 1 Sample 105

Sample Answer 1

The given bar graph compares the consumption of energy in the USA from 1980 and also gives a projection of it till the year 2030. As is presented in the graph, petrol and oil were the main two sources of energy while the use of coal would increase in the coming years.

As is presented in the line graph, initially in 1980 35 quadrillion units of oil and petrol energy was consumed in the USA while 15-20 quadrillion units each of coal and natural gas was consumed. In this year less than 5 quadrillion energy got from nuclear, solar and hydropower was consumed. The consumption of all of these energy sources kept on increasing with some fluctuations. It is projected that in 2030 the consumption of petrol and oil will reach to over 50 quadrillion units while coal and natural gas’s consumption will reach from 20 to 30 quadrillions. The consumption of nuclear, solar/ wind and hydropower will also increase and would reach to over 5 quadrillion units.

In 2030, oil and petrol would be mostly consumed to get energy while in the second most consumed energy source would be coals.

Sample Answer 2

The supplied line graph depicts information about utilisation of energy in the USA since 1980 with predictions until 2030. In general, petrol & oil and coal accounted as high units of fuel consumption in 1980 and will be increased until 2030. In contrast, nuclear, solar/wind and water power were less favourable fuel consumed since 1980 and will be less chosen until 2030.

Looking at the details, petrol and oil reckoned about 35 quadrillion units in 1980 and was true as the highest fuel use at the time and has gone up gradually to about 40 quadrillions in 2015 and will increase to more than 45 quadrillions in 2030. The same trend is true for coal resources. The coal consumption was about 16 quadrillion units in 1980 and the figure levelled up through the observed years and is projected to hit the figure of 30 quadrillion units in 2030. Natural gas utilisation seemed fluctuated over observed years and it points about 20 quadrillion unit in 2015. However, it is predicted to level off until 2030.

In contrast, nuclear, sun/ wind, and hydropower kept small quantities of fuel consumption compared to other fuel sources as they are projected to a tiny amount of fuel utilisation in 2030. Nuclear use was about 4 quadrillion units in 1980 and in 2030 the figure will hit only about 7 quadrillion units. Solar and hydropower also amassed about 4 quadrillions in 1980 and in 2030, the consumption will be only about 5 quadrillions for solar and hydropower will remain the same figure like it was in 1980.

[ Written by – Linda ]

Previous Post

In some countries children have very strict rules of behavior

Next Post

Overweight in many countries is a common problem

Leave a Reply Cancel reply

Your email address will not be published. Required fields are marked *

POPULAR POSTS

Cambridge IELTS 1-19 Book Series [PDF + Audio]

Cambridge IELTS 20 Academic [Update 2025]

Cambridge IELTS 19 Academic [PDF + Audio]

200 IELTS Speaking Sample Answers [PDF + Audio]

IELTS Recent Actual Tests [Full PDF + Audio]

Cambridge IELTS 18 Academic [PDF + Audio]

IELTS Listening Practice Test 204

IELTS Reading Practice Test 320

Cambridge IELTS 18 General Training [PDF + Audio]

Cambridge IELTS 17 General Training [PDF + Audio]

About Us

9ielts logo

9IELTS is dedicated to providing free materials and resources for IELTS conquerors. Stay constantly updated with a wide range of ultimate tips, strategies, and practice tests to crack the high-stakes IELTS exam!

Recent Posts

Television is a very useful tool when it comes to education

Complaints about the reception area where visitors arrive

Describe a story or novel you have read that you found to be particularly interesting

Men can also be as good as women in upbringing children

IELTS Reading Practice Test 26

Disclaimer

The information on this site is for informational purposes only. IELTS is a registered trademark of the University of Cambridge ESOL, the British Council, and IDP Education Australia. This site and its owners are not affiliated, approved or endorsed by University of Cambridge ESOL, the British Council, or IDP Education Australia.
  • About Us
  • Contact Us
  • Disclaimer
  • Terms & Conditions
  • Privacy Policy

© 2024 9IELTS. All Rights Reserved.

No Result
View All Result
  • Listening
    • IELTS Practice Tests
    • Recent Actual Tests
  • Reading
    • IELTS Practice Tests
    • Recent Actual Tests
  • Speaking
    • Speaking Part 1
    • Speaking Part 2
    • Speaking Part 3
  • Writing
    • General Training Writing Task 1
    • Academic Writing Task 1
      • Bar Chart
      • Line Graph
      • Pie Chart
      • Table
      • Map
      • Process Diagram
      • Mixed Charts
    • IELTS Writing Task 2
      • Advantages & Disadvantages Essays
      • Agree or Disagree Essays
      • Discuss Both Views Essays
      • Direct Questions Essays
      • Problems/Causes & Solutions Essays
  • Grammar
  • Vocabulary
    • Speaking Vocabulary
    • Writing Vocabulary
    • Collocations for IELTS
  • Books
  • Blog

© 2024 9IELTS. All Rights Reserved.