• E-mail: [email protected]
  • Listening
    • Cambridge IELTS Tests
    • IELTS Practice Tests
    • Recent Actual Tests
  • Reading
    • Cambridge IELTS Tests
    • IELTS Practice Tests
    • Recent Actual Tests
  • Speaking
    • Speaking Part 1
    • Speaking Part 2
    • Speaking Part 3
  • Writing
    • General Training Writing Task 1
    • Academic Writing Task 1
      • Bar Chart
      • Line Graph
      • Pie Chart
      • Table
      • Map
      • Process Diagram
      • Mixed Charts
    • IELTS Writing Task 2
      • Advantages & Disadvantages Essays
      • Agree or Disagree Essays
      • Discuss Both Views Essays
      • Direct Questions Essays
      • Problems/Causes & Solutions Essays
  • Grammar
  • Vocabulary
    • Speaking Vocabulary
    • Writing Vocabulary
    • Collocation for IELTS
  • IELTS Books
  • Blog
No Result
View All Result
No Result
View All Result
Home IELTS Writing

Effect of flu vaccination in a town

9IELTS by 9IELTS
October 14, 2022
in IELTS Writing, Academic Writing Task 1, Mixed Charts
Reading Time: 3 mins read
4
VIEWS

» You should spend about 20 minutes on this task.

In April 2006, an experimental flu vaccine was trialled on females in a large town. The graphs outline the effect of this vaccination in this town. Write a report for a university lecturer describing the information shown in the diagrams below.

Write at least 150 words.

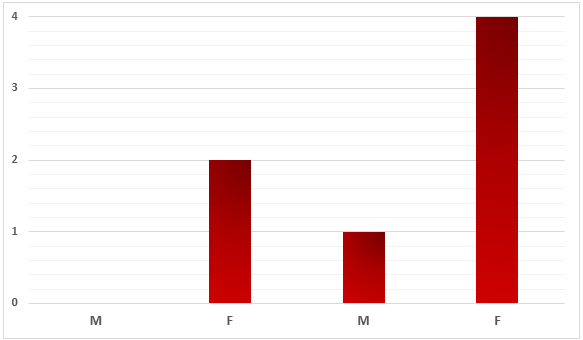
                               Number of Deaths in 2005 – 2006

Effect of flu vaccination in a town.1

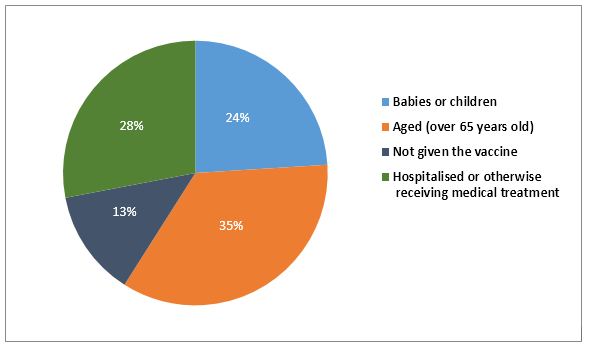
                  Percentages of complaints recorded after the vaccination

Effect of flu vaccination in a town.2

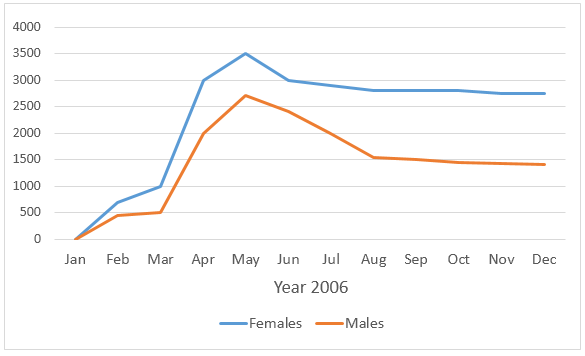
                                Flue Rates for Males and Females

Effect of flu vaccination in a town.3

Sample Answer


The bar graph shows the number of deceased people in a town in 2006, the year when a flu vaccine was trailed, the pie chart presents the ratio of complaints from different patients due to vaccinations and finally the line graph outlines the flu rates among people in this town throughout the year.

According to the bar graph, 2 females died in the town in question in 2005 while no male death was recorded in this year. In 2006, the year the flu vaccine experimented on females in this town, 4 women passed away. However, a male also died in 2006.

The pie chart reveals that the highest percentages of complaints (35%) came from the elderly women (over 65 years). Almost a quarter of the total objections were related to adolescents and 13% related to women who were not given the vaccine. 28% of those objections were made by people who were under medical treatments.

The line graph shows that the flu rate among females was higher throughout the years. In March 2003 around 1000 females suffered from the flu while this was exactly the half among men. After the vaccination in April 2006, the flu cases actually surged. In May 2006, 3500 females had some kind of flues while just over 2500 men suffered from it. After August, the number of cases stabilized but was higher than the earlier of the year, around 2750 cases for female and just below 1500 for men.

Previous Post

The chart shows the percentage of female employees in three job sectors in Greece from 1990 to 2015

Next Post

Number of different airline flights coming to Hong Kong per week

Leave a Reply

Your email address will not be published. Required fields are marked *

POPULAR POSTS

Describe an art exhibition you have visited

IELTS Reading Practice Test 239

Rich countries should allow jobs for employees who are from poor countries

15 Awesome IELTS Websites for Self-study: A Curated List 2022

Describe a sport stadium that’s important in your city

IELTS Listening Practice Test 143

Every year several languages die out

IELTS Reading Practice Test 186

What are some important characteristics of a co-worker

Write a letter to the Registrar complaining about the service you received

About Us

9IELTS

9IELTS is dedicated to providing free materials and resources for IELTS conquerors. Stay constantly updated with a wide range of ultimate tips, strategies, and practice tests to crack the high-stakes IELTS exam!

Recent Posts

IELTS Listening Practice Test 13

IELTS Speaking Part 3: Topic 52

You would like to suggest a place you have visited lately

IELTS Speaking Part 3: Topic 43

The rate of smoking in men and women in Someland

Disclaimer

The information on this site is for informational purposes only. IELTS is a registered trademark of the University of Cambridge ESOL, the British Council, and IDP Education Australia. This site and its owner are not affiliated, approved or endorsed by University of Cambridge ESOL, the British Council, or IDP Education Australia.
  • About Us
  • Contact Us
  • Disclaimer
  • Terms & Conditions
  • Privacy Policy

Copyright © 2023 9IELTS. All Rights Reserved.

No Result
View All Result
  • Listening
    • Cambridge IELTS Tests
    • IELTS Practice Tests
    • Recent Actual Tests
  • Reading
    • Cambridge IELTS Tests
    • IELTS Practice Tests
    • Recent Actual Tests
  • Speaking
    • Speaking Part 1
    • Speaking Part 2
    • Speaking Part 3
  • Writing
    • General Training Writing Task 1
    • Academic Writing Task 1
      • Bar Chart
      • Line Graph
      • Pie Chart
      • Table
      • Map
      • Process Diagram
      • Mixed Charts
    • IELTS Writing Task 2
      • Advantages & Disadvantages Essays
      • Agree or Disagree Essays
      • Discuss Both Views Essays
      • Direct Questions Essays
      • Problems/Causes & Solutions Essays
  • Grammar
  • Vocabulary
    • Speaking Vocabulary
    • Writing Vocabulary
    • Collocation for IELTS
  • IELTS Books
  • Blog

Copyright © 2023 9IELTS. All Rights Reserved.

This site uses cookies to offer you a better browsing experience. By continuing to use this website, you agree to our Privacy Policy.