» You should spend about 20 minutes on this task.
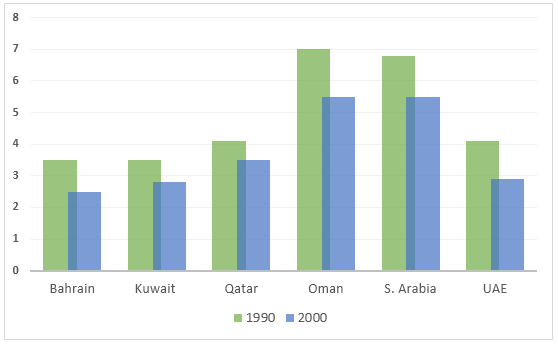
The graph below shows the fertility rate of women in different Gulf Countries from 1990 to 2000.
Write a report describing the information in the graph below.
»You should write at least 150 words.
Sample Answer 1:
The provided bar graph compares the fertility rates of women in 6 different Gulf countries between 1990 and 2000. The fertility rate of those women was compared in two different years with a gap of 10 years – 1990 and 2000. As is evident in the bar graph, the fertility rates declined over the decade in all the countries and women in Oman and Saudi Arabia had higher fertility rates than the women in other four countries.
In 1990, the fertility rate for each woman in Bahrain, Kuwait, Qatar and UAE was on an average between 3 to 4. However, this figures reduced to 2-3 by the year 2000. On the other hand, Omani and Saudi Arabian women had the highest fertility rates during both of the years. Oman had the largest number of childbirths per thousand woman, which was 7 in 1990 and just above 5 in 2000. Meanwhile, Saudi Arabia remained in the second position with relatively a higher fertility rate. It is quite obvious to notice that the fertility rate of women in all these Gulf countries reduced in 2000 than it was 10 years earlier.
To summarise, even though there was a decrease in the women fertility rates, Oman and Saudi Arabian women continued to show a fairly higher fertility rate among the women in these 6 Gulf countries.
[Written by – Tintu]
Sample Answer 2:
The given bar chart compares the fertility rates of women from six Gulf countries in 1990 and 2000. As is observed from the given data, the fertility rate has decreased over the decade and women of Oman and Saudi Arabia had a higher fertility rate than women of other Gulf countries.
According to the bar graph, initially in 1990, the fertility rates (childbirth per thousand women of a certain age range) in Bahrain, Kuwait, Qatar and the UAE were from 3-4. Women from Oman and Saudi Arabia had a fertility rate of more than 6 in this same year. After ten years, this rate reduced in all of the given 6 countries. This indicates the less fertility rate of the women of the Gulf countries. The declination maintained a radio for each country and in the year 2000, the women from Oman and Saudi Arabia had a higher fertility rate than the women in other four Gulf countries.
In summary, the childbirth per thousand women, which is also known as the fertility rate, in the Gulf countries decreased over the time.
Sample Answer 3:
The bar chart compares the number of births per thousand women in six different Arabian countries between 1990 and 2000, with a gap of 10 years. Overall, there was a noticeable drop in the fertility rate of women in all these six nations over the period, and the remarkable drop was recorded in Oman. However, the birth rate was comparatively higher in Oman compared to other nations in the survey throughout the period.
It is clear that though the fertility rate per women in Oman decreased from 7 to just above 5 in 1990, Oman remained to record the highest fertility rate among other nations followed by Saudi Arabia over a period of 10 years. The figures for childbirth per thousand women in Saudi Arabia was above 6 in 1990, which dropped to well over to 5 in 2000. Noticeably when Qatar and UAE registered almost an equal 4 births per thousand women in the initial year of the survey, Bahrain and Kuwait showed a fertility rate between 3 to 4. By contrast, after 10 years, both the nations experienced a similar falling trend in the fertility rates of their women to roughly an equal 3 and just above 2 respectively.
[Written by – Sriya ]