• E-mail: admin@9ielts.com
  • Listening
    • IELTS Practice Tests
    • Recent Actual Tests
  • Reading
    • IELTS Practice Tests
    • Recent Actual Tests
  • Speaking
    • Speaking Part 1
    • Speaking Part 2
    • Speaking Part 3
  • Writing
    • General Training Writing Task 1
    • Academic Writing Task 1
      • Bar Chart
      • Line Graph
      • Pie Chart
      • Table
      • Map
      • Process Diagram
      • Mixed Charts
    • IELTS Writing Task 2
      • Advantages & Disadvantages Essays
      • Agree or Disagree Essays
      • Discuss Both Views Essays
      • Direct Questions Essays
      • Problems/Causes & Solutions Essays
  • Grammar
  • Vocabulary
    • Speaking Vocabulary
    • Writing Vocabulary
    • Collocations for IELTS
  • Books
  • Blog
No Result
View All Result
No Result
View All Result
Home IELTS Writing

Historical oil prices per barrel from 1973 to 2009

9IELTS by 9IELTS
July 18, 2022
in IELTS Writing, Academic Writing Task 1, Line Graph
Reading Time: 3 mins read
30
VIEWS

» You should spend about 20 minutes on this task.

The line graph shows the historical oil prices per barrel from 1973 to January 2009. Summarise the information by selecting and reporting the main features, and make comparisons where relevant.

» Write at least 150 words.
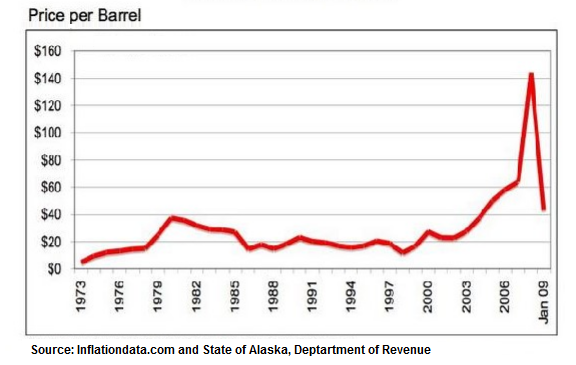
Historical oil prices per barrel from 1973 to 2009

                      Without oil supply disruptions, falling demand corresponds to falling prices.

Sample Answer 1

The line graph illustrates the fluctuations in oil price per Barrel from 1973 to January 2009. The data sources are – inflationdata.com and the Revenue Department of Alaska. Overall, oil price per barrel was as low as 5 USD in 1973 and went as high as USD 143 in 2008 and kept on declining afterwards.

It is clear from the graph that the oil price fluctuated between 1973 and 2003 and reached a peak of approximately 145 USD per Barrel after 2006. From 1973 to 1980, the oil price increased significantly from 5 to 40 USD per Barrel. However, the price went down to about 15 USD per Barrel in 1986 and continued to fluctuate until 2003.

After 10 years of the fluctuations, interestingly enough, the price went up dramatically to as much as 60 USD per Barrel in 2007 and rocketed to roughly 142 USD, which was a peak, in around 2008, and decreased dramatically to 40 USD per Barrel in 2009.

[Written by – Kakada Kuy]

Sample Answer 2

The line graph illustrates changes in oil price between the year 1973 and the first month of 2009. Data is collected by inflationdata.com and the Department of Revenue of Alaska.

Overall, oil price per barrel ranged from as low as 5 dollars in the early years to as high as 145 dollars in recent years. Additionally, it did not go beyond 40 dollars before 2006.

Per barrel of oil was sold at 5 dollars in 1973, which was the lowest price compared with the years afterwards. It took 8 years for the price to increase to approximately 40 dollars, before becoming nearly 20 USD in 1986. From there, oil price fluctuated around 20 dollars a barrel until it dropped to 10 dollars in 1998. However, the price increased 3-fold by the end of the 20th century and furtherly surged to nearly 40 dollars per barrel in 2005. The most noticeable changes took place in the remaining years, as the price reached the zenith of over 140 dollars in 2007. But as of January 2009, after continuous decreases, the figure stood at about 42 dollars a barrel.

[Written by – Nguyen Thuong Vu]

Previous Post

Most important element of a perfect society in the modern world

Next Post

Changes in an American town

Leave a Reply Cancel reply

Your email address will not be published. Required fields are marked *

POPULAR POSTS

Cambridge IELTS 1-19 Book Series [PDF + Audio]

Cambridge IELTS 20 Academic [Update 2025]

Cambridge IELTS 19 Academic [PDF + Audio]

200 IELTS Speaking Sample Answers [PDF + Audio]

Cambridge IELTS 18 Academic [PDF + Audio]

IELTS Recent Actual Tests [Full PDF + Audio]

IELTS Listening Practice Test 204

Cambridge IELTS 18 General Training [PDF + Audio]

IELTS Reading Practice Test 320

Cambridge IELTS 17 General Training [PDF + Audio]

About Us

9ielts logo

9IELTS is dedicated to providing free materials and resources for IELTS conquerors. Stay constantly updated with a wide range of ultimate tips, strategies, and practice tests to crack the high-stakes IELTS exam!

Recent Posts

IELTS Listening Practice Test 96

Smokers can cause themselves serious health problems

Entertainment or leisure activities should be subsidized by the government

IELTS Reading Practice Test 309

Business organisations should hire employees for their entire lives

Disclaimer

The information on this site is for informational purposes only. IELTS is a registered trademark of the University of Cambridge ESOL, the British Council, and IDP Education Australia. This site and its owners are not affiliated, approved or endorsed by University of Cambridge ESOL, the British Council, or IDP Education Australia.
  • About Us
  • Contact Us
  • Disclaimer
  • Terms & Conditions
  • Privacy Policy

© 2024 9IELTS. All Rights Reserved.

No Result
View All Result
  • Listening
    • IELTS Practice Tests
    • Recent Actual Tests
  • Reading
    • IELTS Practice Tests
    • Recent Actual Tests
  • Speaking
    • Speaking Part 1
    • Speaking Part 2
    • Speaking Part 3
  • Writing
    • General Training Writing Task 1
    • Academic Writing Task 1
      • Bar Chart
      • Line Graph
      • Pie Chart
      • Table
      • Map
      • Process Diagram
      • Mixed Charts
    • IELTS Writing Task 2
      • Advantages & Disadvantages Essays
      • Agree or Disagree Essays
      • Discuss Both Views Essays
      • Direct Questions Essays
      • Problems/Causes & Solutions Essays
  • Grammar
  • Vocabulary
    • Speaking Vocabulary
    • Writing Vocabulary
    • Collocations for IELTS
  • Books
  • Blog

© 2024 9IELTS. All Rights Reserved.