» You should spend about 20 minutes on this task.
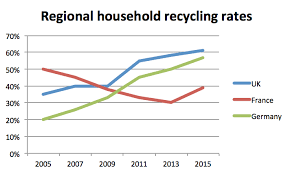
The line graph below shows the household recycling rates in three different countries between 2005 and 2015. Summarise the information by selecting and reporting the main features and make comparisons where relevant.
» Write at least 150 words.

Sample Answer
The given line graph compares the proportion of domestic waste recycling in the UK, France and Germany from 2005 to 2015. Overall, the recycling rates in the UK and Germany increased over the period while it actually decreased in France.
According to the given illustration, the household recycling rate in France was 50% in 2005 which was approximately 13% and 30% higher than that of the UK and Germany respectively. After four years, recycling quotient in these three countries stood at around 40% and the pace actually increases during this period both in Germany and the UK while it dropped in France. The recycling rate in France kept on falling and in 2013 it recycled around 30% household garbage. In the meantime, the recycling rate in Germany and the UK continually improved and both countries recycled over 50% wastages in 2013. In the final year, the household recycling rate in France went high than that of 2013 and stood at 40%. In this year household recycling ratio in the UK was highest, over 60% and in Germany, it was around 58%.
