» You should spend about 20 minutes on this task.
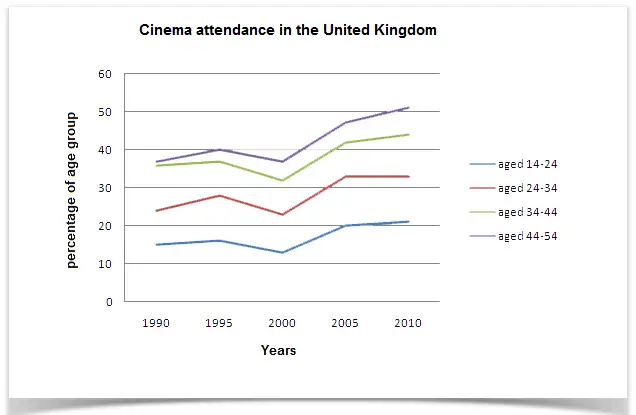
The line graph below gives information on cinema attendance in the UK. Write a report for a university lecturer describing the information given.
» Write at least 150 words.

Sample Answer
The given line graph shows the number of cinema-going UK people and classifies these viewers in four age groups. As is observed from the graph, people over 40 years old went to movies more than the younger people of the UK.
As is observed from the line graph, the people of 44 to 54 years-old attended cinema more than the people of other age groups who are less than 44 years old. Only 15% of the UK citizens who were between 14 to 24 years old attended in cinema in 1990 while this percentage increased with the increase of age group. In this same year, more than 35% people over 40 years attended the cinema. It is clear from the data that, the people in UK trend to attend cinema more with the increase of their age. The cinema goer’s number increased gradually from 1990 to 2010 except for 1995 to 2000. In 2010, the number of cinema attendees was also dominated by the age group of 44 to 54 and the percentage of cinema attendees from all age groups increased by 5% on an average than the percentages were in 2005.
