• E-mail: [email protected]
  • Listening
    • Cambridge IELTS Tests
    • IELTS Practice Tests
    • Recent Actual Tests
  • Reading
    • Cambridge IELTS Tests
    • IELTS Practice Tests
    • Recent Actual Tests
  • Speaking
    • Speaking Part 1
    • Speaking Part 2
    • Speaking Part 3
  • Writing
    • General Training Writing Task 1
    • Academic Writing Task 1
      • Bar Chart
      • Line Graph
      • Pie Chart
      • Table
      • Map
      • Process Diagram
      • Mixed Charts
    • IELTS Writing Task 2
      • Advantages & Disadvantages Essays
      • Agree or Disagree Essays
      • Discuss Both Views Essays
      • Direct Questions Essays
      • Problems/Causes & Solutions Essays
  • Grammar
  • Vocabulary
    • Speaking Vocabulary
    • Writing Vocabulary
    • Collocation for IELTS
  • IELTS Books
  • Blog
No Result
View All Result
No Result
View All Result
Home IELTS Writing

Information on global population figures and figures for urban populations in different world regions

9IELTS by 9IELTS
October 17, 2022
in IELTS Writing, Academic Writing Task 1, Line Graph
Reading Time: 2 mins read
13
VIEWS

You should spend about 20 minutes on this task.

The graphs below provide information on global population figures and figures for urban populations in different world regions. Summarise the information by selecting and reporting the main features, and make comparisons where relevant.

Write at least 150 words.

Information on global population figures and figures for urban populations in different world regions

Sample Answer

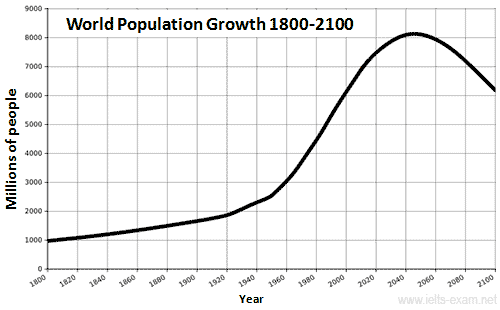
The first graph shows the trend in world population growth between 1800 and 2100, while the second graph gives predicted urban population figures for the next 25 years.

The world population has experienced continuous growth since 1800. Between 1800 and 1950, the population grew slowly from just under 1 billion to 2.5 billion people. After that, the growth rate increased and currently the figure is around 6.5 billion. Projections show a continued increase in population in the near future, but a steady decline in the population growth rate. The global population is expected to peak at 8.2 billion by 2050, and then decline to around 6.2 billion by 2100.

The predictions also show that almost all urban population growth in the next 25 years will occur in cities of developing countries. In developed regions, on the other hand, the urban population is expected to remain unchanged at about 1.3 billion people over the next two decades.

The graphs show that the global population increase will not occur evenly throughout the world, but will be greater in some areas than others.

(180 words)

Previous Post

The number of children ever born to women aged 40-44 years in Australia for each year the information was collected since 1981

Next Post

The percentage of male and female teachers in six different types of educational setting

Leave a Reply

Your email address will not be published. Required fields are marked *

POPULAR POSTS

Describe a free-time activity that you like to do after you have finished your study or work

Collocation for IELTS: Food and Diet

Describe an indoor game that you enjoyed as a child

You would like to participate in a work-related seminar

Mobile phone conversations should be banned in crowded and social places

Describe the most beautiful natural scenery

Describe a place that is special to you

Describe a crowded place

IELTS Reading Practice Test 137

People who have original ideas are of much greater value to society

About Us

9IELTS

9IELTS is dedicated to providing free materials and resources for IELTS conquerors. Stay constantly updated with a wide range of ultimate tips, strategies, and practice tests to crack the high-stakes IELTS exam!

Recent Posts

IELTS Resource Pack [PDF + Audio]

Describe your favourite season

Describe a success your friend has had that you are proud of

There will be soon no role for teachers in the classroom

Sports professionals earn a lot more than people in other important professions

Disclaimer

The information on this site is for informational purposes only. IELTS is a registered trademark of the University of Cambridge ESOL, the British Council, and IDP Education Australia. This site and its owner are not affiliated, approved or endorsed by University of Cambridge ESOL, the British Council, or IDP Education Australia.
  • About Us
  • Contact Us
  • Disclaimer
  • Terms & Conditions
  • Privacy Policy

Copyright © 2023 9IELTS. All Rights Reserved.

No Result
View All Result
  • Listening
    • Cambridge IELTS Tests
    • IELTS Practice Tests
    • Recent Actual Tests
  • Reading
    • Cambridge IELTS Tests
    • IELTS Practice Tests
    • Recent Actual Tests
  • Speaking
    • Speaking Part 1
    • Speaking Part 2
    • Speaking Part 3
  • Writing
    • General Training Writing Task 1
    • Academic Writing Task 1
      • Bar Chart
      • Line Graph
      • Pie Chart
      • Table
      • Map
      • Process Diagram
      • Mixed Charts
    • IELTS Writing Task 2
      • Advantages & Disadvantages Essays
      • Agree or Disagree Essays
      • Discuss Both Views Essays
      • Direct Questions Essays
      • Problems/Causes & Solutions Essays
  • Grammar
  • Vocabulary
    • Speaking Vocabulary
    • Writing Vocabulary
    • Collocation for IELTS
  • IELTS Books
  • Blog

Copyright © 2023 9IELTS. All Rights Reserved.

This site uses cookies to offer you a better browsing experience. By continuing to use this website, you agree to our Privacy Policy.