• E-mail: [email protected]
  • Listening
    • Cambridge IELTS Tests
    • IELTS Practice Tests
    • Recent Actual Tests
  • Reading
    • Cambridge IELTS Tests
    • IELTS Practice Tests
    • Recent Actual Tests
  • Speaking
    • Speaking Part 1
    • Speaking Part 2
    • Speaking Part 3
  • Writing
    • General Training Writing Task 1
    • Academic Writing Task 1
      • Bar Chart
      • Line Graph
      • Pie Chart
      • Table
      • Map
      • Process Diagram
      • Mixed Charts
    • IELTS Writing Task 2
      • Advantages & Disadvantages Essays
      • Agree or Disagree Essays
      • Discuss Both Views Essays
      • Direct Questions Essays
      • Problems/Causes & Solutions Essays
  • Grammar
  • Vocabulary
    • Speaking Vocabulary
    • Writing Vocabulary
    • Collocation for IELTS
  • IELTS Books
  • Blog
No Result
View All Result
No Result
View All Result
Home IELTS Writing

The Marriage and Divorce Statistics for eight countries in 1981 and 1994

9IELTS by 9IELTS
October 12, 2022
in IELTS Writing, Academic Writing Task 1, Bar Chart
Reading Time: 3 mins read
30
VIEWS

You should spend about 20 minutes on this task.

The bar charts below show the Marriage and Divorce Statistics for eight countries in 1981 and 1994.

Write a short report for a university lecturer describing the information shown below.

Write at least 150 words.

Sample Answer 1

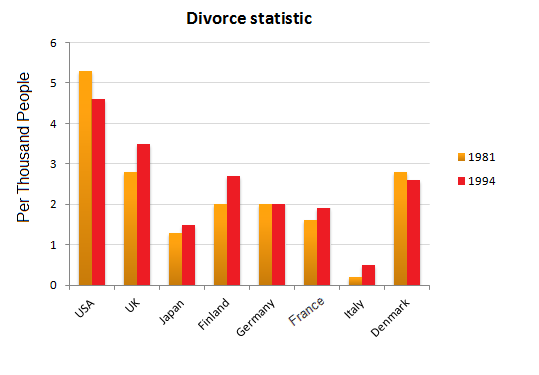
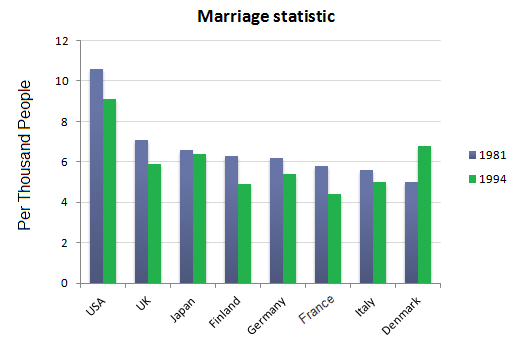
The bar charts show information on marriage and divorce in eight countries between 1981 and 1994. As is observed from the presentation, the marriage rate in all the countries except Denmark decreased over time, while the divorce rate has increased in five out of eight countries.

As is presented in the bar graph, the marriage rate in 1981 in the USA was the highest among the given countries, and that was more than 10 per thousand. In other European countries, namely the United Kingdom, Finland, France, Italy, and Denmark, the marriage rate was around 6 per thousand. Denmark had the lowest rate of marriage in 1981, which was around 5/ thousand. After 15 years, the marriage rate decreased in all the given countries except Denmark, which increased by almost 2/thousand. The only Asian country Japan had minimal changes in their marriage rate.

The divorce statistics show that the highest divorce rate was in the USA, which was more than 4 per thousand. The divorce rate increased in 1994 compared to the rate in 1981 in all the countries except the USA and Denmark. Italy had the lowest divorce rate among the given countries, and there was no change in this rate for the given 2 years in Germany.

Sample Answer 2

The bar graphs represent the total number of marriages and divorces in eight countries between 1981 and 1994. The surveyed nations include the USA, Japan, the UK, Germany, Finland, Denmark, Italy and France. As can be seen in the chart, the rate of marriages in all nations, excluding Denmark, had a sharp decline throughout the survey. However, there seems to be a rise in total divorce cases.

The bar chart represents that the marriage rate in 1981 in the US was the highest compared to other nations, which exceeded 10 per thousand. On the contrary, in 1994, this number declined to 9 per thousand people. In other European nations, including Italy, Denmark, Finland, France and the United Kingdom, the marriage rate was approximately 6 for every thousand people. In 1981, at 5 per thousand, Denmark recorded the lowest number of marriages. The graph also shows that after 15 years, the marriage rate fell further in most countries. However, in Denmark, the number saw an increase, which was nearly 2 per thousand.

In 1981, Germany and Finland recorded almost the same rate, a little more than 6 per thousand. Still, a significant drop was recorded in both of these nations. In Finland, the marriage rate declined to a little more than 4 per thousand in 1994 and closer to 6 in Germany during the same time.

Also, from the divorce statistics, it is clear that the maximum divorce rate was seen in the USA, which was a bit over 5 per thousand in 1981. The divorce rate of 1994 was compared to the marriage rate of 1981 in all countries, including Denmark and the USA. The lowest divorce rate was registered in Italy, among others. Germany showed stability for 2 years. And then, the divorce rate increased slightly from less than 3 per thousand in 1981 to more than 3 in 1994.

Previous Post

Is it right to exclude males or females from certain professions

Next Post

Medals won by countries in the London 2012 Olympic Games

Leave a Reply

Your email address will not be published. Required fields are marked *

POPULAR POSTS

Money management should be taught in high school

How to Apply for IELTS Score Breakdown from BC and IDP

You have seen an advertisement for property management position

Wild animals should be protected

International sporting events are the ideal opportunity to show the world the qualities

Describe an enjoyable day you spent in the countryside

Some people prefer to eat at restaurants while others prefer to prepare and eat at home

Potatoes pasta and rice eaten in a European country

Describe a person in the news you would like to meet

Describe the job you have

About Us

9IELTS

9IELTS is dedicated to providing free materials and resources for IELTS conquerors. Stay constantly updated with a wide range of ultimate tips, strategies, and practice tests to crack the high-stakes IELTS exam!

Recent Posts

Unemployment rates for the female in the UK

IELTS Listening Practice Test 51

Describe someone you know who is very brave

It is sometimes said that borrowing money from a friend can harm or damage the friendship

Public transport is the best way to solve traffic problems in cities

Disclaimer

The information on this site is for informational purposes only. IELTS is a registered trademark of the University of Cambridge ESOL, the British Council, and IDP Education Australia. This site and its owner are not affiliated, approved or endorsed by University of Cambridge ESOL, the British Council, or IDP Education Australia.
  • About Us
  • Contact Us
  • Disclaimer
  • Terms & Conditions
  • Privacy Policy

Copyright © 2023 9IELTS. All Rights Reserved.

No Result
View All Result
  • Listening
    • Cambridge IELTS Tests
    • IELTS Practice Tests
    • Recent Actual Tests
  • Reading
    • Cambridge IELTS Tests
    • IELTS Practice Tests
    • Recent Actual Tests
  • Speaking
    • Speaking Part 1
    • Speaking Part 2
    • Speaking Part 3
  • Writing
    • General Training Writing Task 1
    • Academic Writing Task 1
      • Bar Chart
      • Line Graph
      • Pie Chart
      • Table
      • Map
      • Process Diagram
      • Mixed Charts
    • IELTS Writing Task 2
      • Advantages & Disadvantages Essays
      • Agree or Disagree Essays
      • Discuss Both Views Essays
      • Direct Questions Essays
      • Problems/Causes & Solutions Essays
  • Grammar
  • Vocabulary
    • Speaking Vocabulary
    • Writing Vocabulary
    • Collocation for IELTS
  • IELTS Books
  • Blog

Copyright © 2023 9IELTS. All Rights Reserved.

This site uses cookies to offer you a better browsing experience. By continuing to use this website, you agree to our Privacy Policy.