• E-mail: [email protected]
  • Listening
    • Cambridge IELTS Tests
    • IELTS Practice Tests
    • Recent Actual Tests
  • Reading
    • Cambridge IELTS Tests
    • IELTS Practice Tests
    • Recent Actual Tests
  • Speaking
    • Speaking Part 1
    • Speaking Part 2
    • Speaking Part 3
  • Writing
    • General Training Writing Task 1
    • Academic Writing Task 1
      • Bar Chart
      • Line Graph
      • Pie Chart
      • Table
      • Map
      • Process Diagram
      • Mixed Charts
    • IELTS Writing Task 2
      • Advantages & Disadvantages Essays
      • Agree or Disagree Essays
      • Discuss Both Views Essays
      • Direct Questions Essays
      • Problems/Causes & Solutions Essays
  • Grammar
  • Vocabulary
    • Speaking Vocabulary
    • Writing Vocabulary
    • Collocation for IELTS
  • IELTS Books
  • Blog
No Result
View All Result
No Result
View All Result
Home IELTS Writing

Number of fishers and the world’s top exporters of fish

9IELTS by 9IELTS
October 14, 2022
in IELTS Writing, Academic Writing Task 1, Bar Chart
Reading Time: 3 mins read
3
VIEWS

» You are advised to spend about  20 minutes on this task.

The graph and table below show the number of fishers in millions for different regions in 1980, 1990, and 2000, and the world’s top exporters of fish in 2000.   Summarise the information by selecting and reporting the main features and make comparisons where relevant.

» You should write at least 150 words.

Number of fishers and the world's top exporters of fish.1
Number of fishers and the world's top exporters of fish.2

Sample Answer 1

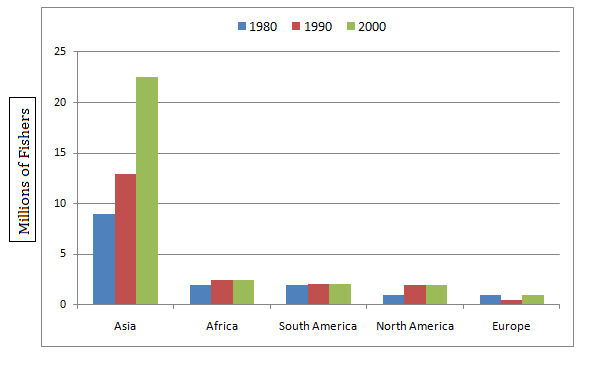
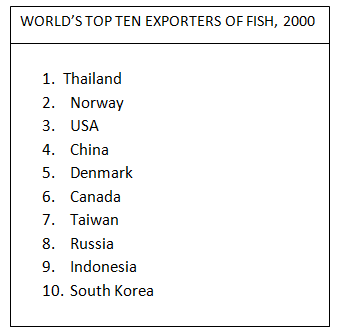
The column graph gives the number of fishers in five different regions in three decades- 1980, 1990 and 2000, while the table lists down the globally top ten fish exporting countries in 2000. Overall, the number of fishermen in Asia soared over the period and Thailand, Norway and the USA was the top three fish exporters in 2000.

Now turning to the details, there were nearly 9 million fishers in Asia in 1980 which was almost double than the combined number of fishers in Africa, America and Europe. Asian population who lived on fishing increased by roughly four million in the next decade while a marginal growth could be observed in the case of other areas except in Europe where the number of fishers actually dropped. In 1990, fishers number in Africa, South America, North America and Europe was less than a million and during the next decade, these numbers remained almost the same except in Europe that witnessed a fractional jump. On the contrary, the number of fishermen in Asia dramatically upsurged and stood at just over 23 million which was overwhelmingly greater than the number of fishers in other parts of the world.

The table presents that, in 2000, Thailand was the top exporter of fish globally and the second and third position of this list were held by Norway and the USA despite their remarkably fewer number of fishermen than Asia. The fourth, seventh and tenth positions of the top ten fish exporting countries were occupied by four Asian countries while the rest were held by other non-Asian countries.

Sample Answer 2

The chart compares the population of fishermen from five different regions in three decades – 1980, 1990 and 2000, and the table lists the top-ten fish exporters in the year 2000.

Overall, the highest number of fishers lived in the Asian continent and their number soared dramatically and more rapidly than any part of the world. Moreover, five Asian countries were positioned on the global top-ten fish exporter list in 2000.

In details, approximately 9 million fishermen lived in Asia in 1980 which was more than the combined fishers in the rest of the world. In this year, Africa and South America each had around 2 to 3 million people whose profession was fishing. The number of fishermen in North America and Europe was even fewer this year. Next decade, Asian fishermen population increased to over 13 million where these numbers slightly grew in African and American continents. In 2000, around 23 million population in Asia were fishers, almost double than the previous decade, while the rest of the continents had around 8-9 million fishermen in total. European fishers were minorities with fractional fluctuations over the range of half a million to a million, the least in any continent.

Tuning to the table data, Thailand, Norway and the USA ranked the top-three fish exporters in 2000.  Despite the small population of fishers in Europe, Norway and Denmark held the second and fifth places on the list. Four other Asian countries were listed among the top-ten while no African country was found on the list.

Previous Post

In the future we will have more and more leisure time

Next Post

In the future we will have more and more leisure time

Leave a Reply

Your email address will not be published. Required fields are marked *

POPULAR POSTS

Some people think that the best way to succeed in life is to get a university education

Music is as important as other subjects in schools

IELTS Listening Practice Test 180

IELTS Reading Practice Test 30

Very few school children learn about the value of money

Tobacco should be treated as illegal like other drugs

Describe a person you wanted to be similar to

The rate of unemployment in some countries is high

Describe a house that you liked when you visited it

Cambridge IELTS 16 Academic [PDF + Audio] Free

About Us

9IELTS

9IELTS is dedicated to providing free materials and resources for IELTS conquerors. Stay constantly updated with a wide range of ultimate tips, strategies, and practice tests to crack the high-stakes IELTS exam!

Recent Posts

Schools should spend more money on computers

Rich nations should help poor countries with their basic needs

Academic Writing Sample Task 1 #19

Competitive sports have a positive effect on the education of teenagers

Chemical fertilizer is being used more nowadays

Disclaimer

The information on this site is for informational purposes only. IELTS is a registered trademark of the University of Cambridge ESOL, the British Council, and IDP Education Australia. This site and its owner are not affiliated, approved or endorsed by University of Cambridge ESOL, the British Council, or IDP Education Australia.
  • About Us
  • Contact Us
  • Disclaimer
  • Terms & Conditions
  • Privacy Policy

Copyright © 2023 9IELTS. All Rights Reserved.

No Result
View All Result
  • Listening
    • Cambridge IELTS Tests
    • IELTS Practice Tests
    • Recent Actual Tests
  • Reading
    • Cambridge IELTS Tests
    • IELTS Practice Tests
    • Recent Actual Tests
  • Speaking
    • Speaking Part 1
    • Speaking Part 2
    • Speaking Part 3
  • Writing
    • General Training Writing Task 1
    • Academic Writing Task 1
      • Bar Chart
      • Line Graph
      • Pie Chart
      • Table
      • Map
      • Process Diagram
      • Mixed Charts
    • IELTS Writing Task 2
      • Advantages & Disadvantages Essays
      • Agree or Disagree Essays
      • Discuss Both Views Essays
      • Direct Questions Essays
      • Problems/Causes & Solutions Essays
  • Grammar
  • Vocabulary
    • Speaking Vocabulary
    • Writing Vocabulary
    • Collocation for IELTS
  • IELTS Books
  • Blog

Copyright © 2023 9IELTS. All Rights Reserved.

This site uses cookies to offer you a better browsing experience. By continuing to use this website, you agree to our Privacy Policy.