• E-mail: admin@9ielts.com
  • Listening
    • IELTS Practice Tests
    • Recent Actual Tests
  • Reading
    • IELTS Practice Tests
    • Recent Actual Tests
  • Speaking
    • Speaking Part 1
    • Speaking Part 2
    • Speaking Part 3
  • Writing
    • General Training Writing Task 1
    • Academic Writing Task 1
      • Bar Chart
      • Line Graph
      • Pie Chart
      • Table
      • Map
      • Process Diagram
      • Mixed Charts
    • IELTS Writing Task 2
      • Advantages & Disadvantages Essays
      • Agree or Disagree Essays
      • Discuss Both Views Essays
      • Direct Questions Essays
      • Problems/Causes & Solutions Essays
  • Grammar
  • Vocabulary
    • Speaking Vocabulary
    • Writing Vocabulary
    • Collocations for IELTS
  • Books
  • Blog
No Result
View All Result
No Result
View All Result
Home IELTS Writing

Participation in education and science in developing and industrialised countries

9IELTS by 9IELTS
July 18, 2022
in IELTS Writing, Academic Writing Task 1, Bar Chart
Reading Time: 3 mins read
6
VIEWS

» You should spend about 20 minutes on this task.

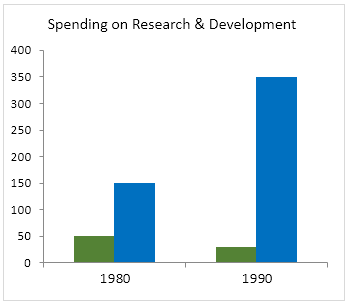
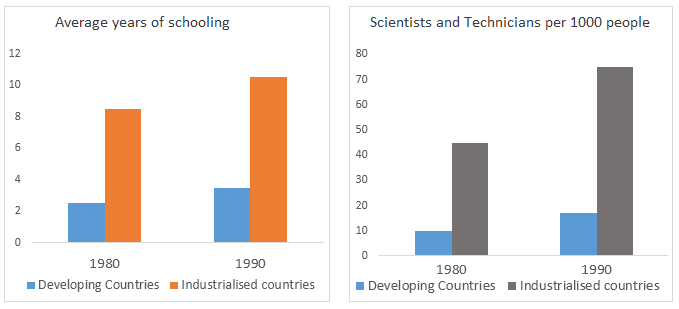
The charts below show the levels of participation in education and science in developing and industrialised countries in 1980 and 1990.

Write a report for a university lecturer describing the information shown below.

» You should write at least 150 words.
Participation in education and science in developing and industrialised countries.1
Participation in education and science in developing and industrialised countries.2

Sample Answer 1

The bar charts compare the average years of education, learners’ participation in science-related career as well as research spending in developing and developed countries from 1980 to 1990.

According to the first bar graph, the average years of schooling in developing countries was only about 2 while this was over 8 years in industrialised countries in 1980. After ten years, the number of year in school on an average increased both in the developing and industrialised countries reaching just over 3 years in developing countries while over 10 years in developed countries.

According to the second graph, the number of Scientist and Technician was much higher in developed countries than the developing countries. The percentage of Scientist and Technician in developing countries both in 1980 and 1990 was below 20 while this was around 50 on an average in developed countries.

Finally, the third graph represents that the amount spent on Research and Development in industrially developed countries was much higher than the spending in developing countries. In 1980 the spending was around 50 billion US dollar in developing countries while this amount was more than 150 billion US dollar in developed countries. Interestingly, after 10 years the spending in Research & Development in developed countries was doubled while that amount decreased almost by 50% in developing countries.

Sample Answer 2

The given bar graphs compare the educational involvements of students in term of total years of education and their participation in science-related subjects in developing and industrial countries from the year 1980 to 1990.

As is presented in the first bar graph, average years of schooling in developing countries were approximately 2 years while in industrial countries schooling years were over 8 years in 1980. Interestingly after one decade schooling years in developing countries magnified to over 3 years while it surged to over 10 years in industrial countries.

As is observed from the second bar graph, the number of scientists and technicians were much higher in industrial countries than in developing countries. Percentage of scientists and technicians were less than 20 percent in developing countries from 1980 to 1990 while it was just over 40 percent in 1980 which soared to approximately 70 percent in 1990.

According to the third bar graph, it can be seen clearly, spending on research and development in industrial countries was far higher than developing countries. The spending in 1980 in developing countries was around 50 billion US dollars while it was 150 billion dollars in industrial countries. Ultimately, after a decade spending on research and development slumped significantly almost 50 percent while spending in industrial countries peaked to approximately 350 billion US dollars respectively.

[ Word Count= 218 | Written by – Faisal Ali ]

Previous Post

Chorleywood is a village near London whose population has increased steadily

Next Post

In cities and towns all over the world the high volume of traffic is a problem

Leave a Reply Cancel reply

Your email address will not be published. Required fields are marked *

POPULAR POSTS

Cambridge IELTS 1-19 Book Series [PDF + Audio]

Cambridge IELTS 20 Academic [Update 2025]

Cambridge IELTS 19 Academic [PDF + Audio]

200 IELTS Speaking Sample Answers [PDF + Audio]

IELTS Recent Actual Tests [Full PDF + Audio]

Cambridge IELTS 18 Academic [PDF + Audio]

IELTS Listening Practice Test 204

IELTS Reading Practice Test 320

Cambridge IELTS 18 General Training [PDF + Audio]

Cambridge IELTS 17 General Training [PDF + Audio]

About Us

9ielts logo

9IELTS is dedicated to providing free materials and resources for IELTS conquerors. Stay constantly updated with a wide range of ultimate tips, strategies, and practice tests to crack the high-stakes IELTS exam!

Recent Posts

Write a letter to your friend to describe your present life

Letter to manager explaining why you were late

IELTS Listening Recent Actual Test 26

IELTS Listening Practice Test 104

Describe someone you know who made a wrong decision

Disclaimer

The information on this site is for informational purposes only. IELTS is a registered trademark of the University of Cambridge ESOL, the British Council, and IDP Education Australia. This site and its owners are not affiliated, approved or endorsed by University of Cambridge ESOL, the British Council, or IDP Education Australia.
  • About Us
  • Contact Us
  • Disclaimer
  • Terms & Conditions
  • Privacy Policy

© 2024 9IELTS. All Rights Reserved.

No Result
View All Result
  • Listening
    • IELTS Practice Tests
    • Recent Actual Tests
  • Reading
    • IELTS Practice Tests
    • Recent Actual Tests
  • Speaking
    • Speaking Part 1
    • Speaking Part 2
    • Speaking Part 3
  • Writing
    • General Training Writing Task 1
    • Academic Writing Task 1
      • Bar Chart
      • Line Graph
      • Pie Chart
      • Table
      • Map
      • Process Diagram
      • Mixed Charts
    • IELTS Writing Task 2
      • Advantages & Disadvantages Essays
      • Agree or Disagree Essays
      • Discuss Both Views Essays
      • Direct Questions Essays
      • Problems/Causes & Solutions Essays
  • Grammar
  • Vocabulary
    • Speaking Vocabulary
    • Writing Vocabulary
    • Collocations for IELTS
  • Books
  • Blog

© 2024 9IELTS. All Rights Reserved.