• E-mail: [email protected]
  • Listening
    • Cambridge IELTS Tests
    • IELTS Practice Tests
    • Recent Actual Tests
  • Reading
    • Cambridge IELTS Tests
    • IELTS Practice Tests
    • Recent Actual Tests
  • Speaking
    • Speaking Part 1
    • Speaking Part 2
    • Speaking Part 3
  • Writing
    • General Training Writing Task 1
    • Academic Writing Task 1
      • Bar Chart
      • Line Graph
      • Pie Chart
      • Table
      • Map
      • Process Diagram
      • Mixed Charts
    • IELTS Writing Task 2
      • Advantages & Disadvantages Essays
      • Agree or Disagree Essays
      • Discuss Both Views Essays
      • Direct Questions Essays
      • Problems/Causes & Solutions Essays
  • Grammar
  • Vocabulary
    • Speaking Vocabulary
    • Writing Vocabulary
    • Collocation for IELTS
  • IELTS Books
  • Blog
No Result
View All Result
No Result
View All Result
Home IELTS Writing

Population distribution in the Northwest Region for 1900-2050

9IELTS by 9IELTS
October 17, 2022
in IELTS Writing, Academic Writing Task 1, Bar Chart
Reading Time: 2 mins read
20
VIEWS

» You should spend about 20 minutes on this task.

The graph below shows the figures for population distribution in the Northwest Region for 1900-2050. Summarise the information by selecting and reporting the main features, and make comparisons where relevant.

» You should write at least 150 words.

                         Population Distribution in the Northwest Region
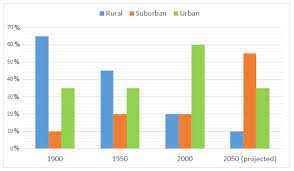
Population distribution in the Northwest Region for 1900-2050

Sample Answer

The bar graph shows the percentages of rural, suburban and urban populations in Northwest region in four different years including the projection of population distribution in 2050. Overall, the percentage of the village-living population rapidly decreased over the time and a great percentage of people will live in city areas in Northwest region in the future.

According to the given column graph, more than six out of ten persons in Northwest region in 1900 lived in rural areas while one out of ten lived in suburban areas. The percentage of urban area’s population was around 35 in this same year. After 5 decades, the population circulation in this region greatly changed and more than half of the population started living in urban and suburban areas. In the year 2000, six out of ten people in this region lived in urban areas while the remaining four were in urban and rural areas. According to the projection in 2050, more than half of the North-western population will live in suburban areas while only 10% will remain in the village area. The remaining 35% of its population would settle in urban areas.

Previous Post

Schools is to turn children into good citizens

Next Post

Governments should spend money on railways rather than roads

Leave a Reply

Your email address will not be published. Required fields are marked *

POPULAR POSTS

Lessons for IELTS Reading [PDF + Audio] Free

Describe a museum

Describe an important holiday that is celebrated in your country

Describe someone you know who has interesting ideas or opinions

IELTS Speaking Part 1: City

Someland’s main exports in 2005 2015 and future projections for 2025

Describe a present or gift someone gave you

Waste recycling rates in the US

Cambridge IELTS 2 [PDF + Audio] Free

Alternative forms of transport should be encouraged to control car ownership

About Us

9IELTS

9IELTS is dedicated to providing free materials and resources for IELTS conquerors. Stay constantly updated with a wide range of ultimate tips, strategies, and practice tests to crack the high-stakes IELTS exam!

Recent Posts

In the future we will have more and more leisure time

Mission IELTS 1, 2 Academic [PDF + Audio]

Compare the proportion of energy capacity in gigawatts (GW)

There has been a trend towards smaller family sizes

Describe a stressful day at school/ university/ work

Disclaimer

The information on this site is for informational purposes only. IELTS is a registered trademark of the University of Cambridge ESOL, the British Council, and IDP Education Australia. This site and its owner are not affiliated, approved or endorsed by University of Cambridge ESOL, the British Council, or IDP Education Australia.
  • About Us
  • Contact Us
  • Disclaimer
  • Terms & Conditions
  • Privacy Policy

Copyright © 2023 9IELTS. All Rights Reserved.

No Result
View All Result
  • Listening
    • Cambridge IELTS Tests
    • IELTS Practice Tests
    • Recent Actual Tests
  • Reading
    • Cambridge IELTS Tests
    • IELTS Practice Tests
    • Recent Actual Tests
  • Speaking
    • Speaking Part 1
    • Speaking Part 2
    • Speaking Part 3
  • Writing
    • General Training Writing Task 1
    • Academic Writing Task 1
      • Bar Chart
      • Line Graph
      • Pie Chart
      • Table
      • Map
      • Process Diagram
      • Mixed Charts
    • IELTS Writing Task 2
      • Advantages & Disadvantages Essays
      • Agree or Disagree Essays
      • Discuss Both Views Essays
      • Direct Questions Essays
      • Problems/Causes & Solutions Essays
  • Grammar
  • Vocabulary
    • Speaking Vocabulary
    • Writing Vocabulary
    • Collocation for IELTS
  • IELTS Books
  • Blog

Copyright © 2023 9IELTS. All Rights Reserved.

This site uses cookies to offer you a better browsing experience. By continuing to use this website, you agree to our Privacy Policy.