• E-mail: [email protected]
  • Listening
    • Cambridge IELTS Tests
    • IELTS Practice Tests
    • Recent Actual Tests
  • Reading
    • Cambridge IELTS Tests
    • IELTS Practice Tests
    • Recent Actual Tests
  • Speaking
    • Speaking Part 1
    • Speaking Part 2
    • Speaking Part 3
  • Writing
    • General Training Writing Task 1
    • Academic Writing Task 1
      • Bar Chart
      • Line Graph
      • Pie Chart
      • Table
      • Map
      • Process Diagram
      • Mixed Charts
    • IELTS Writing Task 2
      • Advantages & Disadvantages Essays
      • Agree or Disagree Essays
      • Discuss Both Views Essays
      • Direct Questions Essays
      • Problems/Causes & Solutions Essays
  • Grammar
  • Vocabulary
    • Speaking Vocabulary
    • Writing Vocabulary
    • Collocation for IELTS
  • IELTS Books
  • Blog
No Result
View All Result
No Result
View All Result
Home IELTS Writing

Results of surveys in 2000, 2005 and 2010 about one university

9IELTS by 9IELTS
October 14, 2022
in IELTS Writing, Academic Writing Task 1, Table
Reading Time: 2 mins read
11
VIEWS

» You should spend about 20 minutes on this task.

The table below shows the results of surveys in 2000, 2005 and 2010 about one university. Summarise the information by selecting and reporting the main features, and make comparisons where relevant.

» Write at least 150 words.
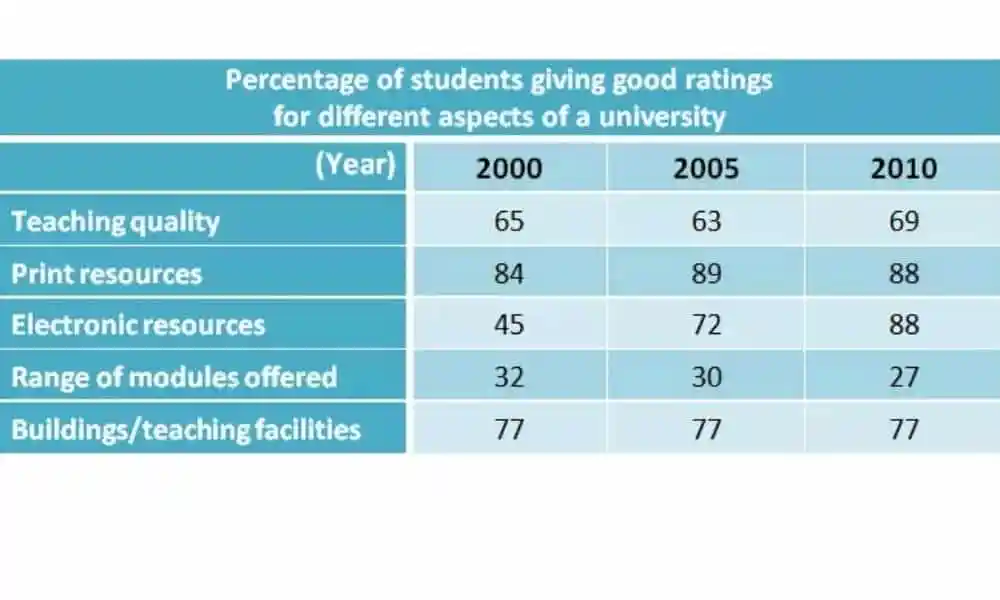
Results of surveys in 2000, 2005 and 2010 about one university

Sample Answer

The table data illustrates the proportion of students who gave good ratings to various aspects of a university in three different years – 2000, 2005 and 2010.

Overall, it is clear that the percentage of students who gave good ratings to five different aspects of the university were comparatively higher in 2010 than previous years with the exception of the range of modules offered by the university.

To begin with,  65 percent students rated the technical quality of the university as excellent in 2000 and this ratio remained more or less the same in the next two surveys. The most striking feature of the data is that there was a significant rise in the percentage of students who rated electronic resources as good. It started off at 45% in 2000, rose to 72% in 2005 and finally, the figure almost doubled in 2010, which was 88%. From 2000 to 2010, there were fluctuations in the percentage of students who gave a good rate for the print resources and also the range of modules offered. While print resources received a steady good rating, 87 to 89 percent, range or major offered received a lower rating in 2010, just 27% rated it as “good”. The modules offered by the university had a lower percentage of good ratings in 2010 than in 2000. Finally, it is interesting to note that the building and teaching facilities remained constant in its percentage of good ratings by the students over the given period – 77% positive rating.

[Written by – Lee Wing Qeen]

Previous Post

Many people strive to maintain a successful career and happy family

Next Post

Roads are becoming more congested

Leave a Reply

Your email address will not be published. Required fields are marked *

POPULAR POSTS

IELTS Listening Practice Test 71

Strict punishments for driving offences are the key to reducing traffic accidents

Describe something you own which is very important to you

You have bought a new mobile phone and it has stopped working

Some people claim that there are different ways of saving energy

International exchange visits will offer various benefits for teenage school students

Write a letter to your friend and invite him to a party

Describe a surprise that made you happy

You forget your bag in the gym and the gym will be closed for a week

Describe a street you know well

About Us

9IELTS

9IELTS is dedicated to providing free materials and resources for IELTS conquerors. Stay constantly updated with a wide range of ultimate tips, strategies, and practice tests to crack the high-stakes IELTS exam!

Recent Posts

Describe a small company that you think is successful

Top ten rice producing countries in the world in 2015

IELTS Reading Practice Test 99

IELTS Reading Practice Test 195

Two possible sites for the school

Disclaimer

The information on this site is for informational purposes only. IELTS is a registered trademark of the University of Cambridge ESOL, the British Council, and IDP Education Australia. This site and its owner are not affiliated, approved or endorsed by University of Cambridge ESOL, the British Council, or IDP Education Australia.
  • About Us
  • Contact Us
  • Disclaimer
  • Terms & Conditions
  • Privacy Policy

Copyright © 2023 9IELTS. All Rights Reserved.

No Result
View All Result
  • Listening
    • Cambridge IELTS Tests
    • IELTS Practice Tests
    • Recent Actual Tests
  • Reading
    • Cambridge IELTS Tests
    • IELTS Practice Tests
    • Recent Actual Tests
  • Speaking
    • Speaking Part 1
    • Speaking Part 2
    • Speaking Part 3
  • Writing
    • General Training Writing Task 1
    • Academic Writing Task 1
      • Bar Chart
      • Line Graph
      • Pie Chart
      • Table
      • Map
      • Process Diagram
      • Mixed Charts
    • IELTS Writing Task 2
      • Advantages & Disadvantages Essays
      • Agree or Disagree Essays
      • Discuss Both Views Essays
      • Direct Questions Essays
      • Problems/Causes & Solutions Essays
  • Grammar
  • Vocabulary
    • Speaking Vocabulary
    • Writing Vocabulary
    • Collocation for IELTS
  • IELTS Books
  • Blog

Copyright © 2023 9IELTS. All Rights Reserved.

This site uses cookies to offer you a better browsing experience. By continuing to use this website, you agree to our Privacy Policy.