You should spend about 20 minutes on this task.
The chart and graph below give information about sales and share prices for Coca-Cola.
Summarise the information by selecting and reporting the main features, and make comparisons where relevant.
Write at least 150 words.

Sample Answer 1
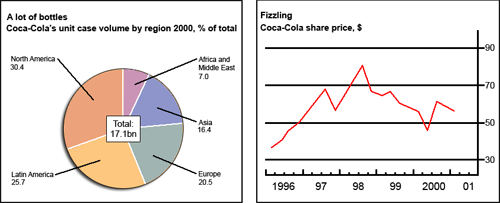
The pie chart shows the worldwide distribution of sales of Coca-Cola in the year 2000 and the graph shows the change in share prices between 1996 and 2001.
In 2000, Coca-Cola sold a total of 17.1 billion cases of its fizzy drink product worldwide. The largest consumer was North America, where 30.4 per cent of the total volume was purchased. The second largest consumer was Latin America. Europe and Asia purchased 20.5 and 16.4 per cent of the total volume, respectively, while Africa and the Middle East remained relatively small consumers at 7 per cent of the total sales volume.
Since 1996, share prices for Coca-Cola have fluctuated. In that year, shares were valued at approximately $35. Between 1996 and 1997, prices rose significantly to $70 per share. They dipped a little in mid-1997 and peaked at $80 per share in mid-98. From then until 2000, their value fell consistently, but there was a slight rise in mid-2000.
Sample Answer 2
The given pie chart and line graph illustrate the consumption of Coca-cola in the year 2000 as well as the share price of Coca-cola company from 1996 to 2001.
Firstly, it is seen that most sales of the company in 2000 were in North America at 30.4%. The figure in Latin America was quite close, at 25.7%; Europe had a little lower share, accounting for 20.5%. In contrast, Asia, Africa and the Middle East had a substantially lower portion at 16.4% and 7%, respectively.
Secondly, Coca-cola’s share price fluctuated in the period shown. The share price was almost 35$ in 1996, gradually increasing to below 70$ in 1997. This was followed by a period of fluctuation, reaching its peak of 80$ in 1998. It was followed by a steady decline, although with a bit of fluctuation, to reach its lowest point since 1996 at 48$. Finally, it reached 57$ in 2001.
Sample Answer 3
The rendered pie and line chart provides information regarding the sales and share price of coca-cola, i.e. soft drink brand. Overall, 17.4 billion bottles were sold in different regions worldwide in 2000. Secondly, fluctuations could be easily noticed in share price from 1996 to 2000.
Firstly, North America acted as the largest segment, representing 31% of the total. Sequentially, Latin America conquered second place with around 4.5 billion bottles. 20.5% and 16.4% were sold by Europe and Asia regions, respectively. Lastly, Africa and the Middle East contributed 7% in all.
Following this, the Share price for 1996 was about 33 dollars. A rise of almost 35 dollars could be observed from 1996 to 1997. Facing fluctuations, the share price went to its zenith of approximately 80 dollars. For the year 1999 till 2000, constant variation of seen, which ended at 53 dollars.
Sample Answer 4
The chart represents the number of Coca-Cola bottles sold, and the line graph illustrates the share prices for Coca-Cola. Overall, the most significant number of sales are in North America while the least number of sales are in Africa and the Middle East. The share price of Coca-Cola increased from 30$ in 1996 to more than 70$ in 1998.
In 2000, Coca-Cola sold a total of 17.1 billion cases of its fizzy drink product worldwide. The largest consumer was North America, where 30.4 per cent of the total sales. The second-largest consumer was Latin America. Europe and Asia purchased 20.5 and 16.4 per cent of the total sales, respectively, while Africa and the Middle East remained relatively small consumers at 7 per cent of the total sales.
Since 1996, share prices for Coca-Cola have fluctuated. In that year, shares were valued at approximately $35. Between 1996 and 1997, prices rose significantly to almost $70 per share. They dipped a little in mid-1997 and peaked at $80 per share in mid-98. From then until 2000, their value fell consistently, but there was a slight rise in mid-2000.
