You should spend about 20 minutes on this task.
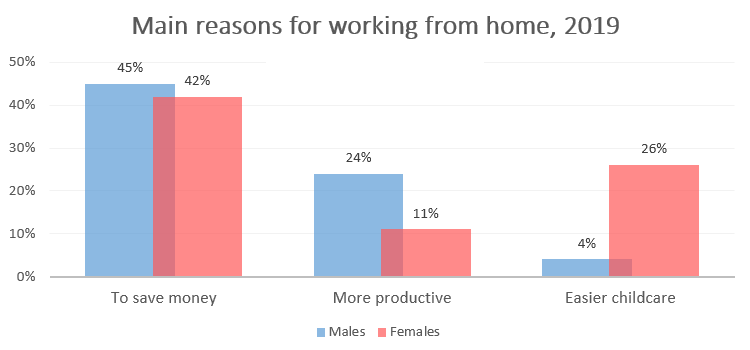
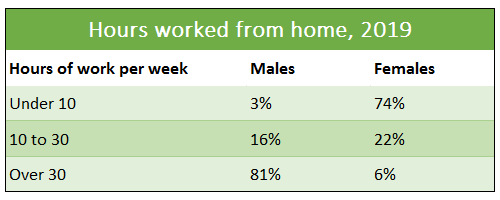
The diagrams below show the main reasons workers chose to work from home and the hours males and females worked at home for the year 2019.
Summarise the information by selecting and reporting the main features, and make comparisons where relevant.
Write at least 150 words.


Sample Answer
The bar chart illustrates why men and women chose to work from home in 2019. Overall, saving money was the main reason for males and females (45% and 42% respectively). In contrast, approximately a quarter of males put productivity as a reason, which was twice as high as the female response (24% and 11%, respectively). The pattern was different for childcare, with almost a quarter of females giving this reason compared to very few males (4%).
The table shows the hours men and women worked from home in 2019. The vast majority of males worked over 30 hours per week (81%), contrasting with a minority of females (6%) doing similar hours. This pattern is reversed when examining the under ten hours category, with almost three-quarters of females working this amount compared to only 3% of males. The 10 to 30 hours per week category shows fewer marked differences.
To sum up, it can be seen that men and women do not always give the exact reasons for home working and, generally, men work longer hours from home.
