• E-mail: admin@9ielts.com
  • Listening
    • Cambridge IELTS Tests
    • IELTS Practice Tests
    • Recent Actual Tests
  • Reading
    • Cambridge IELTS Tests
    • IELTS Practice Tests
    • Recent Actual Tests
  • Speaking
    • Speaking Part 1
    • Speaking Part 2
    • Speaking Part 3
  • Writing
    • General Training Writing Task 1
    • Academic Writing Task 1
      • Bar Chart
      • Line Graph
      • Pie Chart
      • Table
      • Map
      • Process Diagram
      • Mixed Charts
    • IELTS Writing Task 2
      • Advantages & Disadvantages Essays
      • Agree or Disagree Essays
      • Discuss Both Views Essays
      • Direct Questions Essays
      • Problems/Causes & Solutions Essays
  • Grammar
  • Vocabulary
    • Speaking Vocabulary
    • Writing Vocabulary
    • Collocation for IELTS
  • IELTS Books
  • Blog
No Result
View All Result
No Result
View All Result
Home IELTS Writing

The percentage of tourists to England who visited four different attractions

9IELTS by 9IELTS
October 17, 2022
in IELTS Writing, Academic Writing Task 1, Line Graph
Reading Time: 2 mins read
38
VIEWS

You should spend about 20 minutes on this task.

The line graph below shows the percentage of tourists to England who visited four different attractions in Brighton. Summarise the information by selecting and reporting the main features, and make comparisons where relevant.

Write at least 150 words.
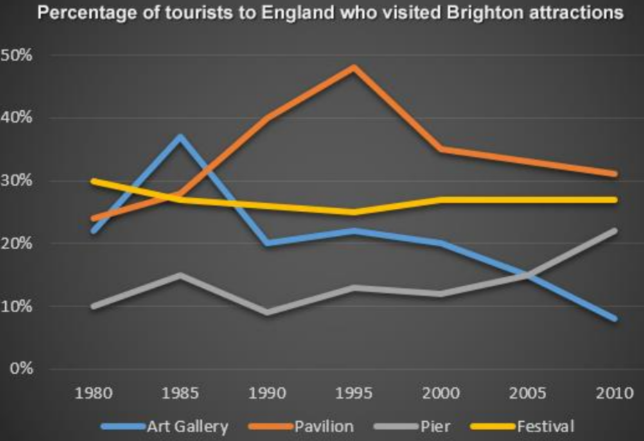
The percentage of tourists to England who visited four different attractions

Sample Answer

The line graph shows the percentage of tourists to England who visited certain Brighton attractions between 1980 and 2010. We can see that in 1980 and in 2010 the favourite attractions were the pavilion and the festival. In 1980 the least popular attraction was the pier but in 2010 this changed and the art gallery was the least popular.

During the 1980s and 1990s there was a sharp increase in visitors to the pavilion from 28% to 48% and then the percentage gradually went down to 31% in 2010. The trend for the art gallery was similar to the pavilion. Visitors increased rapidly from 22% to 37% from 1980 to 1985 then gradually decreased to less than 10% over the next twenty-five years. The number of tourists who visited the Brighton Festival fluctuated slightly but in general remained steady at about 25%. Visitors to the pier also fluctuated from 1980 to 2000 then rose significantly from 12% to 22% between 2000 and 2010.

(163 words)

Previous Post

The changes that have taken place at Queen Mary Hospital since its construction

Next Post

Some employment patterns in Great Britain in 1992

Leave a Reply Cancel reply

Your email address will not be published. Required fields are marked *

POPULAR POSTS

More and more people are choosing to read e-books rather than paper books

IELTS Speaking Part 1: Smile

Education overseas has become more accessible

IELTS Speaking Vocabulary: Clothes and Fashion

To improving the public health other measures should be taken

You are planning a surprise birthday party for a friend

What Are Collocations?

Letter to your teacher asking for a reference

Computers are replacing more and more jobs

Usually students have to study a range of different subjects

About Us

9ielts-logo

9IELTS is dedicated to providing free materials and resources for IELTS conquerors. Stay constantly updated with a wide range of ultimate tips, strategies, and practice tests to crack the high-stakes IELTS exam!

Recent Posts

Describe a person in the news whom you want to meet

International exchange visits will offer various benefits for teenage school students

Describe a friend who has played an important part in your life

Children in rural communities have less access to education

IELTS Reading Practice Test 280

Disclaimer

The information on this site is for informational purposes only. IELTS is a registered trademark of the University of Cambridge ESOL, the British Council, and IDP Education Australia. This site and its owner are not affiliated, approved or endorsed by University of Cambridge ESOL, the British Council, or IDP Education Australia.
  • About Us
  • Contact Us
  • Disclaimer
  • Terms & Conditions
  • Privacy Policy

© 2023 9IELTS. All Rights Reserved.

No Result
View All Result
  • Listening
    • Cambridge IELTS Tests
    • IELTS Practice Tests
    • Recent Actual Tests
  • Reading
    • Cambridge IELTS Tests
    • IELTS Practice Tests
    • Recent Actual Tests
  • Speaking
    • Speaking Part 1
    • Speaking Part 2
    • Speaking Part 3
  • Writing
    • General Training Writing Task 1
    • Academic Writing Task 1
      • Bar Chart
      • Line Graph
      • Pie Chart
      • Table
      • Map
      • Process Diagram
      • Mixed Charts
    • IELTS Writing Task 2
      • Advantages & Disadvantages Essays
      • Agree or Disagree Essays
      • Discuss Both Views Essays
      • Direct Questions Essays
      • Problems/Causes & Solutions Essays
  • Grammar
  • Vocabulary
    • Speaking Vocabulary
    • Writing Vocabulary
    • Collocation for IELTS
  • IELTS Books
  • Blog

© 2023 9IELTS. All Rights Reserved.

This site uses cookies to offer you a better browsing experience. By continuing to use this website, you agree to our Privacy Policy.