• E-mail: [email protected]
  • Listening
    • Cambridge IELTS Tests
    • IELTS Practice Tests
    • Recent Actual Tests
  • Reading
    • Cambridge IELTS Tests
    • IELTS Practice Tests
    • Recent Actual Tests
  • Speaking
    • Speaking Part 1
    • Speaking Part 2
    • Speaking Part 3
  • Writing
    • General Training Writing Task 1
    • Academic Writing Task 1
      • Bar Chart
      • Line Graph
      • Pie Chart
      • Table
      • Map
      • Process Diagram
      • Mixed Charts
    • IELTS Writing Task 2
      • Advantages & Disadvantages Essays
      • Agree or Disagree Essays
      • Discuss Both Views Essays
      • Direct Questions Essays
      • Problems/Causes & Solutions Essays
  • Grammar
  • Vocabulary
    • Speaking Vocabulary
    • Writing Vocabulary
    • Collocation for IELTS
  • IELTS Books
  • Blog
No Result
View All Result
No Result
View All Result
Home IELTS Writing

The UK’s ageing population in 1985 and makes predictions for 2035

9IELTS by 9IELTS
August 1, 2022
in IELTS Writing, Academic Writing Task 1, Bar Chart
Reading Time: 2 mins read
4
VIEWS

You should spend about 20 minutes on this task.

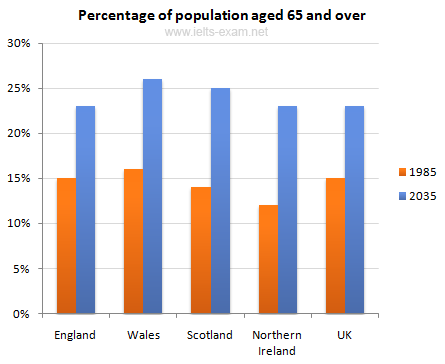
The chart below gives information about the UK’s ageing population in 1985 and makes predictions for 2035. Summarise the information by selecting and reporting the main features, and make comparisons where relevant.

Write at least 150 words.

The UK's ageing population in 1985 and makes predictions for 2035

Sample answer

The graph shows how the size and distribution of the UK’s ageing population is likely to change over a 50-year period.

Overall, the proportions are predicted to increase in all UK countries. In 1985, 15 per cent of the UK population was over 65, but by 2035, this will account for 23 per cent of the total population.

A closer look at the data reveals that the ageing population is expected to rise more in some parts of the UK than in other. In 1985, Wales had the highest percentage of people aged 65 and over, at 16 per cent. The second-largest group could be found in England and the third in Scotland. Northern Ireland had lowest proportion, with 12 per cent aged 65 and over.

By 2035, Wales is still going to have by far the greatest percentage of over 65s, with figures likely to reach 26 per cent. However, the biggest increases in this age group, relative to the rest of the population, are predicted to occur in Northern Ireland and Scotland. In Northern Ireland, for example, this figure will increase almost double to 23 per cent.

(189 words)

Previous Post

A structure that is used to generate electricity from wave power

Next Post

Information on transport and car use in Edmonton

Leave a Reply Cancel reply

Your email address will not be published. Required fields are marked *

POPULAR POSTS

Information about international tourist arrivals in five countries

Grammar and Vocabulary for Advanced with Answers [PDF + Audio]

Describe a free-time activity that you like to do after you have finished your study or work

Describe some local news that people in your locality interested in

Describe a place where you want to have a home

You are looking for a full-time job

Describe a time when you were friendly to someone you did not like

International marketing is sometimes seen as invasive and an intrusion

Describe a skill which is important to you

Zoos have no purpose in today’s world and should be closed

About Us

9IELTS

9IELTS is dedicated to providing free materials and resources for IELTS conquerors. Stay constantly updated with a wide range of ultimate tips, strategies, and practice tests to crack the high-stakes IELTS exam!

Recent Posts

Describe a teacher from the past whom you remember

Describe a thing you cannot live without

Internet usage in Taiwan by age group

Whether or not a person achieves their aims in life is mostly related to luck

Describe someone who has a lot of responsibilities

Disclaimer

The information on this site is for informational purposes only. IELTS is a registered trademark of the University of Cambridge ESOL, the British Council, and IDP Education Australia. This site and its owner are not affiliated, approved or endorsed by University of Cambridge ESOL, the British Council, or IDP Education Australia.
  • About Us
  • Contact Us
  • Disclaimer
  • Terms & Conditions
  • Privacy Policy

Copyright © 2023 9IELTS. All Rights Reserved.

No Result
View All Result
  • Listening
    • Cambridge IELTS Tests
    • IELTS Practice Tests
    • Recent Actual Tests
  • Reading
    • Cambridge IELTS Tests
    • IELTS Practice Tests
    • Recent Actual Tests
  • Speaking
    • Speaking Part 1
    • Speaking Part 2
    • Speaking Part 3
  • Writing
    • General Training Writing Task 1
    • Academic Writing Task 1
      • Bar Chart
      • Line Graph
      • Pie Chart
      • Table
      • Map
      • Process Diagram
      • Mixed Charts
    • IELTS Writing Task 2
      • Advantages & Disadvantages Essays
      • Agree or Disagree Essays
      • Discuss Both Views Essays
      • Direct Questions Essays
      • Problems/Causes & Solutions Essays
  • Grammar
  • Vocabulary
    • Speaking Vocabulary
    • Writing Vocabulary
    • Collocation for IELTS
  • IELTS Books
  • Blog

Copyright © 2023 9IELTS. All Rights Reserved.

This site uses cookies to offer you a better browsing experience. By continuing to use this website, you agree to our Privacy Policy.