» You are advised to spend about a maximum of 20 minutes on this task. Write about the following topic:
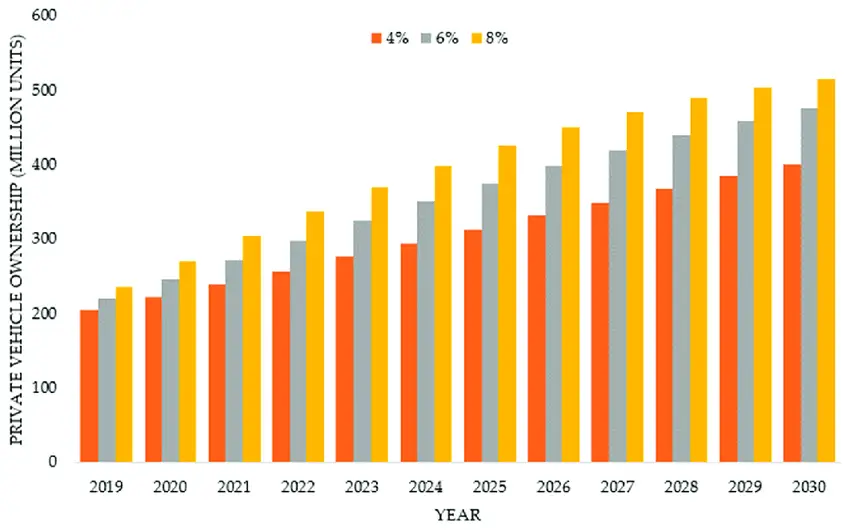
The bar chart below gives information about vehicle ownership in China. Write a report for a university lecturer describing the information.
» You should write at least 150 words.

Sample Answer 1
The provided bar chart reveals data about vehicle ownership by Chinese citizens from 1987 to 1999. The data shows the number of automobiles owned by per thousand people.
In general, the possession of different kinds of motorised transportations increased rapidly during the last nine years of the given period. Vehicle ownership in this period increased steadily and it was far quicker after 1993.
To begin with, in 1987 one thousand Chinese people owned only around 30 vehicles which increased over 50 in just two years. The rate kept on increasing every year and in 1995 this number reached to 200. There was a dramatic increase in terms of ownership of vehicles in China in around 1995 and it reached to over 300 per thousand people in 1997 which means almost every three Chinese citizens owed a car. The percentage of vehicle ownership soared more than double in just 4 years from 1996 to 1999. In the final year, 1999, more than 400 vehicles were owned by per thousand Chinese people and that was an overwhelming figure compared to their vehicle ownership in 1987.
[ Written by – Waode Eti ]
Sample Answer 2
The bar graph depicts information about motorised vehicle possessions in China during a twelve-year period – from 1987 until 1999.
In general, the number of automobiles owned by Chinese citizens increased gradually and marked a noticeable change in vehicle ownership during the observed times.
Looking at the details, vehicle ownership in China in 1987 pertained a figure about 30 vehicles per thousand individuals. This number swelled modestly between the year of 1987 and before 1995 which was about 10% vehicles ownership. Furthermore, in 1995, the number of car possessions went up dramatically, about 200 vehicles and was double than the previous number. This figure grew significantly through the following years and in 1999, and it accounted for a steep increase, almost 4,10 vehicles per thousand citizens. The figure extremely noticed a significant change in vehicle ownership between 1987 and 1999. In 1999, it was reckoned approximately twelve times higher than the rate of vehicle possessions in China in 1987.
[ Written by Linda ]
Sample Answer 3
The diagram illustrates how many cars per thousand Chinese held between the years 1987 and 1999. As a general trend, motorised vehicle ownership in China increased significantly and in just 12 years, it skyrocketed.
According to the column graph, motor car ownership in China in 1987 was quite low as less than 30 cars were owned by per thousand Chinese. In 1989, it crossed 50 cars ownership per thousand Chinese people and this trend continued in the next years. Then, in 1991, every ten people owned a vehicle on an average and this number kept on increasing in the following years. In 1995, 200 cars were owned by a thousand Chinese. After 2 years, this number reached to 300 which indicate that almost every three persons in China owned a car. In the final year, the number of cars owned by a thousand Chinese citizens crossed 400 and that was more than 13 times higher than the initial figure in 1987.
[Writtne by – Li Wei]
