You should spend about 20 minutes on this task.
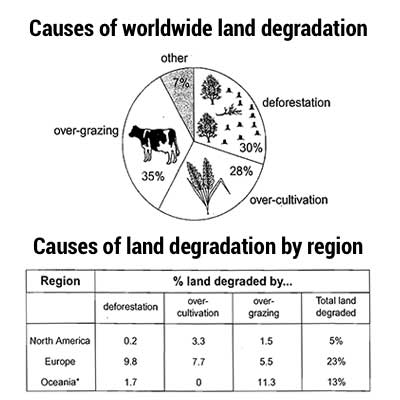
The pie chart below shows the main reasons why agricultural land becomes less productive. The table shows how these causes affected three regions of the world during the 1990s. Summarise the information by selecting and reporting the main features, and make comparisons where relevant.
Write at least 150 words.

Sample Answer
The pie chart shows that there are four main causes of farmland becoming degraded in the world today. Globally, 65% of degradation is caused by too much animal grazing and tree clearance, constituting 35% and 30% respectively. A further 28% of global degradation is due to over-cultivation of crops. Other causes account for only 7% collectively.
These causes affected different regions differently in the 1990s, with Europe having as much as 9.8% of degradation due to deforestation, while the impact of this on Oceania and North America was minimal, with only 1.7% and 0.2% of land affected respectively. Europe, with the highest overall percentage of land degraded (23%), also suffered from over-cultivation (7.7%) and over-grazing (5.5%). In contrast, Oceania had 13% of degraded farmland and this was mainly due to over-grazing (11.3%). North America had a lower proportion of degraded land at only 5%, and the main causes of this were over-cultivation (3.3%) and, to a lesser extent, over-grazing (1.5%).
Overall, it is clear that Europe suffered more from farmland degradation than the other regions and the main causes there were deforestation and over-cultivation.
(184 words)
