• E-mail: [email protected]
  • Listening
    • Cambridge IELTS Tests
    • IELTS Practice Tests
    • Recent Actual Tests
  • Reading
    • Cambridge IELTS Tests
    • IELTS Practice Tests
    • Recent Actual Tests
  • Speaking
    • Speaking Part 1
    • Speaking Part 2
    • Speaking Part 3
  • Writing
    • General Training Writing Task 1
    • Academic Writing Task 1
      • Bar Chart
      • Line Graph
      • Pie Chart
      • Table
      • Map
      • Process Diagram
      • Mixed Charts
    • IELTS Writing Task 2
      • Advantages & Disadvantages Essays
      • Agree or Disagree Essays
      • Discuss Both Views Essays
      • Direct Questions Essays
      • Problems/Causes & Solutions Essays
  • Grammar
  • Vocabulary
    • Speaking Vocabulary
    • Writing Vocabulary
    • Collocation for IELTS
  • IELTS Books
  • Blog
No Result
View All Result
No Result
View All Result
Home IELTS Writing

The main reasons why agricultural land becomes less productive

9IELTS by 9IELTS
October 15, 2022
in IELTS Writing, Academic Writing Task 1, Pie Chart
Reading Time: 2 mins read
7
VIEWS

You should spend about 20 minutes on this task.

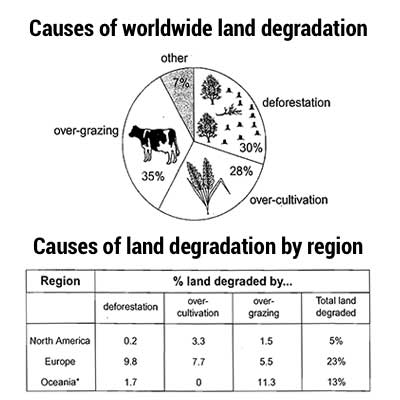
The pie chart below shows the main reasons why agricultural land becomes less productive. The table shows how these causes affected three regions of the world during the 1990s. Summarise the information by selecting and reporting the main features, and make comparisons where relevant.

Write at least 150 words.
The main reasons why agricultural land becomes less productive

Sample Answer

The pie chart shows that there are four main causes of farmland becoming degraded in the world today. Globally, 65% of degradation is caused by too much animal grazing and tree clearance, constituting 35% and 30% respectively. A further 28% of global degradation is due to over-cultivation of crops. Other causes account for only 7% collectively.

These causes affected different regions differently in the 1990s, with Europe having as much as 9.8% of degradation due to deforestation, while the impact of this on Oceania and North America was minimal, with only 1.7% and 0.2% of land affected respectively. Europe, with the highest overall percentage of land degraded (23%), also suffered from over-cultivation (7.7%) and over-grazing (5.5%). In contrast, Oceania had 13% of degraded farmland and this was mainly due to over-grazing (11.3%). North America had a lower proportion of degraded land at only 5%, and the main causes of this were over-cultivation (3.3%) and, to a lesser extent, over-grazing (1.5%).

Overall, it is clear that Europe suffered more from farmland degradation than the other regions and the main causes there were deforestation and over-cultivation.

(184 words)

Previous Post

Information about a restaurant’s average sales in three different branches

Next Post

The pollution levels in London between 1600 and 2000

Leave a Reply

Your email address will not be published. Required fields are marked *

POPULAR POSTS

An experimental flu vaccine was trialled in a large country town on females only

Describe a family business which is successful

Watching TV is bad for children

Write a letter of recommendation for your friend

Food budget average Australian family spent on restaurant

Everyone wants to have a car a television and a fridge

Describe something special you brought home from a holiday

What Are Punctuation Marks?

IELTS Reading Practice Test 42

Describe a time when you got lost

About Us

9IELTS

9IELTS is dedicated to providing free materials and resources for IELTS conquerors. Stay constantly updated with a wide range of ultimate tips, strategies, and practice tests to crack the high-stakes IELTS exam!

Recent Posts

The challenges people face when they go to live in other countries

Certain prisoners should be made to do unpaid community work

Many students have to study subjects which they do not like

Life is now better that it was 100 years ago

IELTS Reading Practice Test 17

Disclaimer

The information on this site is for informational purposes only. IELTS is a registered trademark of the University of Cambridge ESOL, the British Council, and IDP Education Australia. This site and its owner are not affiliated, approved or endorsed by University of Cambridge ESOL, the British Council, or IDP Education Australia.
  • About Us
  • Contact Us
  • Disclaimer
  • Terms & Conditions
  • Privacy Policy

Copyright © 2023 9IELTS. All Rights Reserved.

No Result
View All Result
  • Listening
    • Cambridge IELTS Tests
    • IELTS Practice Tests
    • Recent Actual Tests
  • Reading
    • Cambridge IELTS Tests
    • IELTS Practice Tests
    • Recent Actual Tests
  • Speaking
    • Speaking Part 1
    • Speaking Part 2
    • Speaking Part 3
  • Writing
    • General Training Writing Task 1
    • Academic Writing Task 1
      • Bar Chart
      • Line Graph
      • Pie Chart
      • Table
      • Map
      • Process Diagram
      • Mixed Charts
    • IELTS Writing Task 2
      • Advantages & Disadvantages Essays
      • Agree or Disagree Essays
      • Discuss Both Views Essays
      • Direct Questions Essays
      • Problems/Causes & Solutions Essays
  • Grammar
  • Vocabulary
    • Speaking Vocabulary
    • Writing Vocabulary
    • Collocation for IELTS
  • IELTS Books
  • Blog

Copyright © 2023 9IELTS. All Rights Reserved.

This site uses cookies to offer you a better browsing experience. By continuing to use this website, you agree to our Privacy Policy.