• E-mail: [email protected]
  • Listening
    • Cambridge IELTS Tests
    • IELTS Practice Tests
    • Recent Actual Tests
  • Reading
    • Cambridge IELTS Tests
    • IELTS Practice Tests
    • Recent Actual Tests
  • Speaking
    • Speaking Part 1
    • Speaking Part 2
    • Speaking Part 3
  • Writing
    • General Training Writing Task 1
    • Academic Writing Task 1
      • Bar Chart
      • Line Graph
      • Pie Chart
      • Table
      • Map
      • Process Diagram
      • Mixed Charts
    • IELTS Writing Task 2
      • Advantages & Disadvantages Essays
      • Agree or Disagree Essays
      • Discuss Both Views Essays
      • Direct Questions Essays
      • Problems/Causes & Solutions Essays
  • Grammar
  • Vocabulary
    • Speaking Vocabulary
    • Writing Vocabulary
    • Collocation for IELTS
  • IELTS Books
  • Blog
No Result
View All Result
No Result
View All Result
Home IELTS Writing

The percentage of students who passed their high school competency exams

9IELTS by 9IELTS
October 14, 2022
in IELTS Writing, Academic Writing Task 1, Bar Chart
Reading Time: 2 mins read
18
VIEWS

You should spend about 20 minutes on this task.

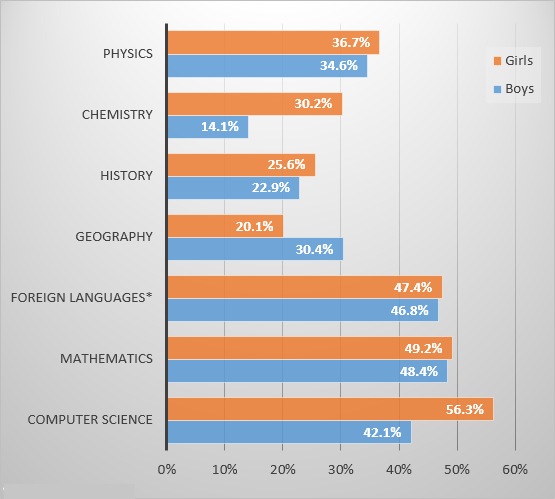
The bar chart below shows the percentage of students who passed their high school competency exams, by subject and gender, during the period 2010-2011. Summarise the information by selecting and reporting the main features, and make comparisons where relevant.

Write at least 150 words.

The percentage of students who passed their high school competency exams

Look at the graph and complete the following model answer by writing NO MORE THAN THREE WORDS in each space.

Sample Answer

The graph shows the percentages of boys and girls who were successful in their high school competency exams in the period from 2010 to 2011, by subject.

Overall, students of both sexes  best in Computer Science, Mathematics, and Foreign Languages,  French, German and Spanish. Results for boys and girls were roughly  in Computer Science and Mathematics. In other subjects, , there were some significant .

Girls achieved by far their  in Computer Science, with a pass rate of , which was  than the boys. The difference was even  in Chemistry, where  more girls passed.  subject where boys’ results were better than girls was  where they achieved a pass rate of , which was 10% higher than  for girls.

In general,  that during the period in question girls performed better in most subjects in the competency exams than boys.

Previous Post

Students living in the UK gaining English language teacher training qualifications

Next Post

The worldwide market share of the notebook computer market for manufacturers

Leave a Reply

Your email address will not be published. Required fields are marked *

POPULAR POSTS

Professionals of other important sectors are comparatively less paid

Women should play an equal role as men in a country’s police force or military force

Young people have gained status and power but old people have lost

It is essential to learn history

Television has changed the quality of life for the ordinary person

IELTS Listening Practice Test 117

Describe a piece of artwork that you have seen before

IELTS Speaking Part 1: Sports

IELTS Target 7.0: Preparation for IELTS Academic Course Book

Describe a free-time activity that you like to do after you have finished your study or work

About Us

9IELTS

9IELTS is dedicated to providing free materials and resources for IELTS conquerors. Stay constantly updated with a wide range of ultimate tips, strategies, and practice tests to crack the high-stakes IELTS exam!

Recent Posts

Describe someone you wanted to be similar to when you were growing up

Types of YouTube ads their average lengths

Why is careful planning important in the development of cities

Describe a party that you enjoyed

IELTS Listening Practice Test 105

Disclaimer

The information on this site is for informational purposes only. IELTS is a registered trademark of the University of Cambridge ESOL, the British Council, and IDP Education Australia. This site and its owner are not affiliated, approved or endorsed by University of Cambridge ESOL, the British Council, or IDP Education Australia.
  • About Us
  • Contact Us
  • Disclaimer
  • Terms & Conditions
  • Privacy Policy

Copyright © 2023 9IELTS. All Rights Reserved.

No Result
View All Result
  • Listening
    • Cambridge IELTS Tests
    • IELTS Practice Tests
    • Recent Actual Tests
  • Reading
    • Cambridge IELTS Tests
    • IELTS Practice Tests
    • Recent Actual Tests
  • Speaking
    • Speaking Part 1
    • Speaking Part 2
    • Speaking Part 3
  • Writing
    • General Training Writing Task 1
    • Academic Writing Task 1
      • Bar Chart
      • Line Graph
      • Pie Chart
      • Table
      • Map
      • Process Diagram
      • Mixed Charts
    • IELTS Writing Task 2
      • Advantages & Disadvantages Essays
      • Agree or Disagree Essays
      • Discuss Both Views Essays
      • Direct Questions Essays
      • Problems/Causes & Solutions Essays
  • Grammar
  • Vocabulary
    • Speaking Vocabulary
    • Writing Vocabulary
    • Collocation for IELTS
  • IELTS Books
  • Blog

Copyright © 2023 9IELTS. All Rights Reserved.

This site uses cookies to offer you a better browsing experience. By continuing to use this website, you agree to our Privacy Policy.