• E-mail: admin@9ielts.com
  • Listening
    • IELTS Practice Tests
    • Recent Actual Tests
  • Reading
    • IELTS Practice Tests
    • Recent Actual Tests
  • Speaking
    • Speaking Part 1
    • Speaking Part 2
    • Speaking Part 3
  • Writing
    • General Training Writing Task 1
    • Academic Writing Task 1
      • Bar Chart
      • Line Graph
      • Pie Chart
      • Table
      • Map
      • Process Diagram
      • Mixed Charts
    • IELTS Writing Task 2
      • Advantages & Disadvantages Essays
      • Agree or Disagree Essays
      • Discuss Both Views Essays
      • Direct Questions Essays
      • Problems/Causes & Solutions Essays
  • Grammar
  • Vocabulary
    • Speaking Vocabulary
    • Writing Vocabulary
    • Collocations for IELTS
  • Books
  • Blog
No Result
View All Result
No Result
View All Result
Home IELTS Writing Academic Writing Task 1

Academic Writing Sample Task 1 #20

9IELTS by 9IELTS
July 7, 2022
in Academic Writing Task 1
Reading Time: 2 mins read
9
VIEWS

You should spend about 20 minutes on this task.

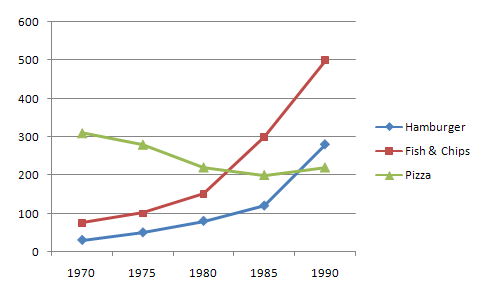
Write a report for a university lecturer describing the information in the graph.

Write at least 150 words.

Consumption of Fast Food in the UK
Academic IELTS Writing

Model answer 1

The graph shows changes in the amount
of fast food consumed in the UK between 1970 and 1990. Several trends are apparent.
First, Britons are eating more and more fast food. Secondly, the type of fast food
has changed.

In 1970, the most popular fast food was fish and chips. Over 300g were consumed
each week. By 1990, however, this had fallen to just over 200g – a 50% drop. Consumption
of other fast foods such as pizza and hamburgers increased, however. The amount
of pizza eaten shot up from about 20g a week to more than 270g, overtaking fish
and chips in the late 1980s. Hamburger consumption also increased, rising from about
80g in 1970 to almost 300g in 1990.

Accompanying this change in the choice of foods was an increase in the amount of
fast food consumed. In 1970, British consumers ate about 450g a week of fast food.
In 1990, on the other hand, this had more than doubled, to 1000g.

Model answer 2

The graph shows the amount of fast food eaten between 1970
and 1990 in grams per person per week. Overall, the amount of fast food eaten more
than doubled.

The amount of fish and chips eaten declined slightly. In 1970, the consumption was
about 300g/week. This fell to 220g/week in 1990.

In contrast, sales of hamburger and pizza rocketed. In 1970, very little pizza was
eaten – less than 50g/week. This rose to 280g/week by 1990. In the same period,
hamburger sales shot up by more than 500%, from 100g/week in 1970 to 500 grams in
1990.

In conclusion, although there was a big increase in the consumption of pizza and
hamburger, sales of fish and chips decreased.

Previous Post

Academic Writing Sample Task 1 #21

Next Post

Academic Writing Sample Task 1 #19

Leave a Reply Cancel reply

Your email address will not be published. Required fields are marked *

POPULAR POSTS

Cambridge IELTS 1-19 Book Series [PDF + Audio]

Cambridge IELTS 20 Academic [Update 2025]

Cambridge IELTS 19 Academic [PDF + Audio]

IELTS Listening Practice Test 203

200 IELTS Speaking Sample Answers [PDF + Audio]

Cambridge IELTS 18 Academic [PDF + Audio]

IELTS Recent Actual Tests [Full PDF + Audio]

IELTS Listening Practice Test 204

IELTS Reading Practice Test 320

Cambridge IELTS 18 General Training [PDF + Audio]

About Us

9ielts logo

9IELTS is dedicated to providing free materials and resources for IELTS conquerors. Stay constantly updated with a wide range of ultimate tips, strategies, and practice tests to crack the high-stakes IELTS exam!

Recent Posts

Heart Attacks by Ages and Genders in USA

Describe a street that you know well

Education is the single most important factor in the development

The percentage participation of women in senior management in three companies

The manager at your company is going to retire next month

Disclaimer

The information on this site is for informational purposes only. IELTS is a registered trademark of the University of Cambridge ESOL, the British Council, and IDP Education Australia. This site and its owners are not affiliated, approved or endorsed by University of Cambridge ESOL, the British Council, or IDP Education Australia.
  • About Us
  • Contact Us
  • Disclaimer
  • Terms & Conditions
  • Privacy Policy

© 2024 9IELTS. All Rights Reserved.

No Result
View All Result
  • Listening
    • IELTS Practice Tests
    • Recent Actual Tests
  • Reading
    • IELTS Practice Tests
    • Recent Actual Tests
  • Speaking
    • Speaking Part 1
    • Speaking Part 2
    • Speaking Part 3
  • Writing
    • General Training Writing Task 1
    • Academic Writing Task 1
      • Bar Chart
      • Line Graph
      • Pie Chart
      • Table
      • Map
      • Process Diagram
      • Mixed Charts
    • IELTS Writing Task 2
      • Advantages & Disadvantages Essays
      • Agree or Disagree Essays
      • Discuss Both Views Essays
      • Direct Questions Essays
      • Problems/Causes & Solutions Essays
  • Grammar
  • Vocabulary
    • Speaking Vocabulary
    • Writing Vocabulary
    • Collocations for IELTS
  • Books
  • Blog

© 2024 9IELTS. All Rights Reserved.