» You should spend about 20 minutes on this task.
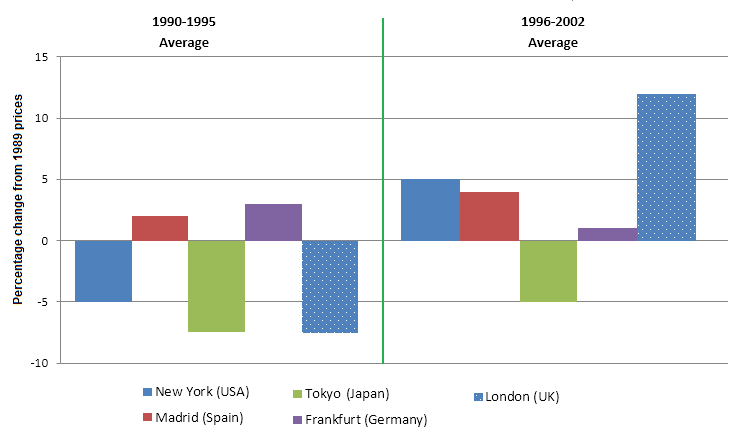
The chart below shows information about changes in average house prices in five different cities between 1990 and 2002 compared with the average house prices in 1989.Summarise the information by selecting and reporting the main features, and make comparisons where relevant.
» You should write at least 150 words.
Percentage change in average house prices in five different cities
1990 – 2002 compared with 1989.
Sample Answer 1
The given chart shows data on the changes in the prices of houses in two spans of periods, 1990 – 1995 and 1996 – 2002 compared to the prices of 1989. As is presented in the bar graph, prices of the house got down in New York, Tokyo and London during 1990 to 1995 while the prices increased in London & New York during 1996 to 2002 compared to the prices of those houses in 1989.
According to the bar graph, the prices of houses in Madrid and Frankfurt increased by 2-3% during 1990 – 1995 while the prices decreased in New York, Tokyo and London by 5 to 8% in the same period compared to the prices of those houses in 1989.
Interestingly during the period 1996 to 2002, the prices in all cities except Frankfurt increased. Price increases of housing were 5% in New York, 4% Madrid, and over 11% in London compared to their prices in 1989. The only city where the prices decreased in 1996 to 2002 compared to the previous 5 years was Frankfurt.
Sample Answer 2
The bar chart depicts the average house prices in five different cities between 1990 and 2002 compared with the prices of the year 1989, a period of 12 years. Overall, it can be seen that the average house prices in London were shown fluctuating throughout the year.
In details, the percentage of house prices in New York in between the year 1990 -1995 was accounted just 5 percent in a negative direction. However, the same percentage in New York was on the positive side between 1996 – 2002. Similarly, the average house prices in London and Tokyo (Japan) was presented in similar percentage approximately7 percent in negative in 1990-1995 where the percentage of London peaks at the highest position at 13 percent in 1996-2002 and Tokyo city house price was still observed the on the negative side at 5 percent.
The percentage change in average house price of Madrid (Spain) was only 1 percent in previous 6 years but it dramatically increased 4 times in next following year. In 1990-1995 the average house price of Frankfurt (Germany) was only 2 percent but it was interesting that it declines and reached the same percentage as Madrid (Spain) at 1 percent.
[ Written by – Labin Sapkota ]
Sample Answer 3
The bar graph illustrates the mean variation in the price of a house in five various cities when compared with that in 1989 in a period of 12 years from the year 1990. Overall, it is clearly shown that majority of these five cities had their house prices lower from 1990 to 1995 than that in the year 1989 whereas all cities showed an upward trend in the average house prices between the years 1996 and 2002 except Frankfurt.
First and foremost, the house prices in Tokyo were lower than that in the year 1989 throughout the given period. However, there was a rise in the house prices from 1996 to 2002 than from 1990 to 1995 (-5% and approximately -7% respectively) which was comparatively lower than that in 1989. Furthermore, every city had its house prices rising over the period except Frankfurt in Germany which showed a slight drop of about 1%.
Interestingly, London was the city that had the largest variation in house prices among the five cities from 1990 to 2002 in comparison with that in 1989 (around 19% in total). There was a bigger fluctuation in house prices in New York than in Madrid in Spain (10% and nearly 5% correspondingly).
[ Written by – Lee Wing Qeen ]
Sample Answer 4
The bar chart demonstrates what changes five major cities experienced in average house prices in the span of periods: 1990-1995 and 1996-2002, compared with the average home value of 1989. Overall, house buying costs went down considerably in New York, Tokyo and London between the period of 1990-1996 while it augmented dramatically in London with a gradual increase in New York and Madrid cities during 1996-2002.
A closer look at the graph reveals the fact that average houses purchasing price during 1900-1995 in Tokyo and London decreased by approximately 7% compared with the average price in 1989. However, during the same period, Madrid and Frankfurt experienced a property price rise by about 1% and 1.5% respectively.
Looking at the figures between 1996-2002, average house price in London went up dramatically, almost 12%, the largest property price hike. Meanwhile, property prices upsurged by 5%, just below 5% and around 1% consecutively in New York, Madrid and Frankfurt. Interestingly, only London went through 5% decline in average price of houses over the same period of time.
[By – Jiban]