You should spend about 20 minutes on this task.
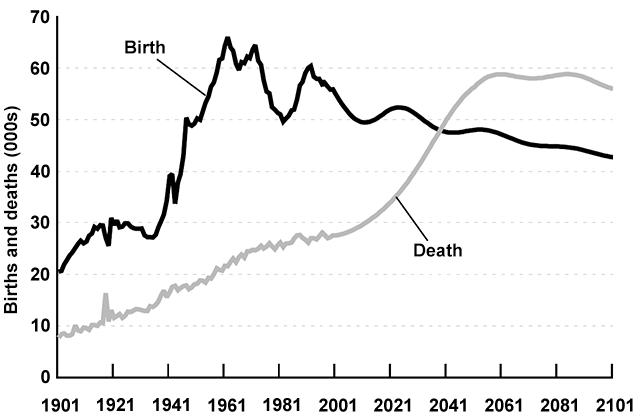
The graph below gives information about changes in the birth and death rates in New Zealand between 1901 and 2101. Summarise the information by selecting and reporting the main features, and make comparisons where relevant.
Write at least 150 words.

Sample Answer
The graph shows changes in the birth and death rates in New Zealand since 1901, and forecasts trends tip until 2101.
Between 1901 and the present day, the birth rate has been consistently higher than the death rate. It stood at 20,000 at the start of this period and increased to a peak of 66,000 in 1961. Since then the rate has fluctuated between 65 and 50 thousand and it is expected to decline slowly to around 45,000 births by the end of the century.
In contrast, the death rate started below 10,000 and has increased steadily until the present time. This increase is expected to be more rapid between 2021 and 2051 when the rate will probably level off at around 60,000, before dropping slightly in 2101.
Overall, these opposing trends mean that the death rate will probably overtake the birth rate in around 2041 and the large gap between the two levels will be reversed in the later part of this century.
(164 words)
