• E-mail: admin@9ielts.com
  • Listening
    • IELTS Practice Tests
    • Recent Actual Tests
  • Reading
    • IELTS Practice Tests
    • Recent Actual Tests
  • Speaking
    • Speaking Part 1
    • Speaking Part 2
    • Speaking Part 3
  • Writing
    • General Training Writing Task 1
    • Academic Writing Task 1
      • Bar Chart
      • Line Graph
      • Pie Chart
      • Table
      • Map
      • Process Diagram
      • Mixed Charts
    • IELTS Writing Task 2
      • Advantages & Disadvantages Essays
      • Agree or Disagree Essays
      • Discuss Both Views Essays
      • Direct Questions Essays
      • Problems/Causes & Solutions Essays
  • Grammar
  • Vocabulary
    • Speaking Vocabulary
    • Writing Vocabulary
    • Collocations for IELTS
  • Books
  • Blog
No Result
View All Result
No Result
View All Result
Home IELTS Writing

Changes in world population by region between 1910 and 2010

9IELTS by 9IELTS
July 18, 2022
in IELTS Writing, Academic Writing Task 1, Pie Chart
Reading Time: 3 mins read
54
VIEWS

» You are advised to spend about  20 minutes on this task.

The two pie charts below show changes in world population by region between 1910 and 2010. Summarise the information by selecting and reporting the main features, and make comparisons where relevant.

» You should write at least 150 words.

Changes in world population by region between 1910 and 2010.2

Sample Answer 1

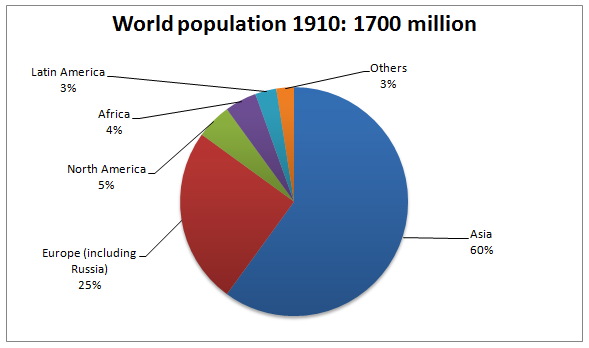
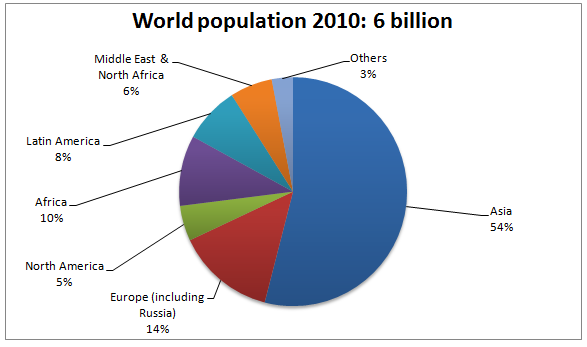
The pie charts compare the population distribution in different regions of the world in 1910 and 2010 and also depicts the changes in global population in these territories. A glance at the diagrams reveals that more than half of the world citizens resided in Asia, both in 1910 and 2010, and the ratio of the global population division decreased in Asia and Europe in a century.

According to the given illustration, in 1910, the global inhabitants was 1.7 billion which overwhelmingly increased and reached to 6 billion in just 100 years. Six out of every ten persons, in 1910, lived in Asia, making it the region with exactly 60% global people. Then Europe and Russia comprised one-fourth of the global citizenry while 3% and 5% of the global community lived in Latin America and North America. Finally, the lowest percentage of the population allotment could be observed in Latin America and African region had one and a half percent more citizen share in this year.

After a century, 2010, to be exact, the population diffusion in different parts of the world changes. More than half of the world population were in Asia, though it is precisely six percent fewer than that of a century back. North America’s percentages of the population remained unchanged but made it the continent with the lowest percentage of the world population which was previously held by the Latin America. Interestingly, population distribution in Europe and Russia dropped to almost half while it more than doubled in Latin America and Africa. Finally, six percent people lived in the Middle East and North Africa in 2010 though no data was given for this region explicitly in the first pie chart.

Sample Answer 2

The pie charts depict the global population shift between 1910 and 2010. At the onset, it is clear that the global inhabitants increased remarkably in just 100 years and the major proportion of it lived in Asia.

As can be seen from the illustration, more than half of the world population lived in Asia in both years. From 1910 to 2010, the percentages of population in Europe, Russia and Asia dropped; European population from 25% to 14% and population in Asia from 60% to 54%. During this time, African’s percentage of global population soared from just 4.5% to 10% while in Latin America it jumped from 3% to 8%. The percentage of the population in North America, however, remained constant, staying at 5% both in 1910 and 2010. Then the Middle East and North Africa, representing a new region, accommodated 6% of world population in 2010. The global population percentages in the remaining areas of the world rose slightly from 2.5% to 3%.The global population in a century jumped from 1.7 billion to 6 billion.

Previous Post

How rainwater is reused for domestic purposes

Next Post

Percentage of UK adolescents following a vegetarian diet

Leave a Reply Cancel reply

Your email address will not be published. Required fields are marked *

POPULAR POSTS

Cambridge IELTS 1-19 Book Series [PDF + Audio]

Cambridge IELTS 20 Academic [Update 2025]

Cambridge IELTS 19 Academic [PDF + Audio]

200 IELTS Speaking Sample Answers [PDF + Audio]

Cambridge IELTS 18 Academic [PDF + Audio]

IELTS Recent Actual Tests [Full PDF + Audio]

IELTS Listening Practice Test 204

IELTS Reading Practice Test 320

Cambridge IELTS 18 General Training [PDF + Audio]

Cambridge IELTS 17 General Training [PDF + Audio]

About Us

9ielts logo

9IELTS is dedicated to providing free materials and resources for IELTS conquerors. Stay constantly updated with a wide range of ultimate tips, strategies, and practice tests to crack the high-stakes IELTS exam!

Recent Posts

Nowadays people normally stretch their work hours and get stressed

As children become adults their social behaviour changes

IELTS Reading Practice Test 310

IELTS Speaking Part 3: Topic 26

IELTS Model Essays: 65 Sample IELTS Essays

Disclaimer

The information on this site is for informational purposes only. IELTS is a registered trademark of the University of Cambridge ESOL, the British Council, and IDP Education Australia. This site and its owners are not affiliated, approved or endorsed by University of Cambridge ESOL, the British Council, or IDP Education Australia.
  • About Us
  • Contact Us
  • Disclaimer
  • Terms & Conditions
  • Privacy Policy

© 2024 9IELTS. All Rights Reserved.

No Result
View All Result
  • Listening
    • IELTS Practice Tests
    • Recent Actual Tests
  • Reading
    • IELTS Practice Tests
    • Recent Actual Tests
  • Speaking
    • Speaking Part 1
    • Speaking Part 2
    • Speaking Part 3
  • Writing
    • General Training Writing Task 1
    • Academic Writing Task 1
      • Bar Chart
      • Line Graph
      • Pie Chart
      • Table
      • Map
      • Process Diagram
      • Mixed Charts
    • IELTS Writing Task 2
      • Advantages & Disadvantages Essays
      • Agree or Disagree Essays
      • Discuss Both Views Essays
      • Direct Questions Essays
      • Problems/Causes & Solutions Essays
  • Grammar
  • Vocabulary
    • Speaking Vocabulary
    • Writing Vocabulary
    • Collocations for IELTS
  • Books
  • Blog

© 2024 9IELTS. All Rights Reserved.