• E-mail: [email protected]
  • Listening
    • Cambridge IELTS Tests
    • IELTS Practice Tests
    • Recent Actual Tests
  • Reading
    • Cambridge IELTS Tests
    • IELTS Practice Tests
    • Recent Actual Tests
  • Speaking
    • Speaking Part 1
    • Speaking Part 2
    • Speaking Part 3
  • Writing
    • General Training Writing Task 1
    • Academic Writing Task 1
      • Bar Chart
      • Line Graph
      • Pie Chart
      • Table
      • Map
      • Process Diagram
      • Mixed Charts
    • IELTS Writing Task 2
      • Advantages & Disadvantages Essays
      • Agree or Disagree Essays
      • Discuss Both Views Essays
      • Direct Questions Essays
      • Problems/Causes & Solutions Essays
  • Grammar
  • Vocabulary
    • Speaking Vocabulary
    • Writing Vocabulary
    • Collocation for IELTS
  • IELTS Books
  • Blog
No Result
View All Result
No Result
View All Result
Home IELTS Writing

Commuters using different modes of transports in London

9IELTS by 9IELTS
October 14, 2022
in IELTS Writing, Academic Writing Task 1, Bar Chart
Reading Time: 2 mins read
2
VIEWS

» You should spend about 20 minutes on this task.

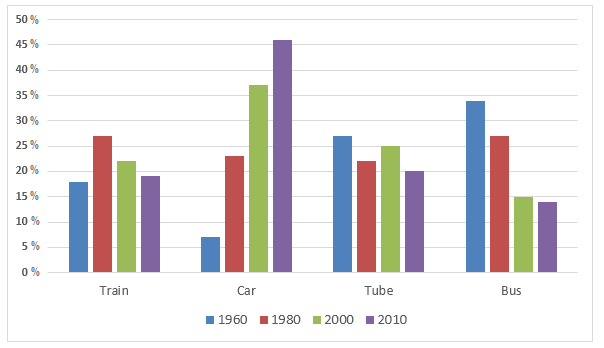
The graph presents percentages of commuters using different modes of transports in London in the years 1960, 1980, 2000 and 2010. Write a report for a university lecturer describing the information shown in the diagram below.

Write at least 150 words.

                                           Commuter Transport in London

Commuters using different modes of transports in London

Sample Answer


The column graph compares the percentages of Londoners who used trains, cars, tubes and buses in four different years. Overall, the use of private cars increased rapidly while the popularity of public buses dropped sharply.

As can be seen, roughly 7% commuters used private cars in London in 1960. In this year the highest percentages of commuters in London used buses and tubes, approximately 35% and 27% respectively. Train users in this year comprised around 17% of total passengers. After 20 years, the percentages of car users dramatically increased and one out of five Londoners used this mean of transport. Trains, buses and tubes received similar percentages of travellers in 1980 which ranged from 23% to 26%. However, the ratio of these transport users in 2000 changed noticeably. Every passenger out of three used their cars while one out of four used tubes for their movements. The popularity of the train somewhat decreased while the ratio of bus commuters dropped sharply to only 15%. In 2010, around half of the Londoners used cars as they primary mean of communication while less than 15% used public cars. The popularity of tubes and trains slightly dropped in this year as well.

Previous Post

Destinations of holiday makers from a particular Asian country

Next Post

English men and women who were living alone in 2011

Leave a Reply

Your email address will not be published. Required fields are marked *

POPULAR POSTS

Describe a party that you have attended which made you happy

The highest level of education achieved by women in Someland

IELTS Writing Vocabulary: Crime & Punishment

The consumer durables (telephone, refrigerator, etc.) owned in Britain

Many people use written language in a less formal way

Describe a time you gave advice to others

Environmental problems affect all the people in the world

Nowadays many people work part or full time from home

IELTS Reading Practice Test 51

Lessons for IELTS Writing [PDF] Free

About Us

9IELTS

9IELTS is dedicated to providing free materials and resources for IELTS conquerors. Stay constantly updated with a wide range of ultimate tips, strategies, and practice tests to crack the high-stakes IELTS exam!

Recent Posts

Teenage years are the happiest of our lives

Consumer should avoid over packed products

Describe a book or movie that had a major influence on you

Companies are allowing employees to work at home

Many schools face severe problems with student behaviour

Disclaimer

The information on this site is for informational purposes only. IELTS is a registered trademark of the University of Cambridge ESOL, the British Council, and IDP Education Australia. This site and its owner are not affiliated, approved or endorsed by University of Cambridge ESOL, the British Council, or IDP Education Australia.
  • About Us
  • Contact Us
  • Disclaimer
  • Terms & Conditions
  • Privacy Policy

Copyright © 2023 9IELTS. All Rights Reserved.

No Result
View All Result
  • Listening
    • Cambridge IELTS Tests
    • IELTS Practice Tests
    • Recent Actual Tests
  • Reading
    • Cambridge IELTS Tests
    • IELTS Practice Tests
    • Recent Actual Tests
  • Speaking
    • Speaking Part 1
    • Speaking Part 2
    • Speaking Part 3
  • Writing
    • General Training Writing Task 1
    • Academic Writing Task 1
      • Bar Chart
      • Line Graph
      • Pie Chart
      • Table
      • Map
      • Process Diagram
      • Mixed Charts
    • IELTS Writing Task 2
      • Advantages & Disadvantages Essays
      • Agree or Disagree Essays
      • Discuss Both Views Essays
      • Direct Questions Essays
      • Problems/Causes & Solutions Essays
  • Grammar
  • Vocabulary
    • Speaking Vocabulary
    • Writing Vocabulary
    • Collocation for IELTS
  • IELTS Books
  • Blog

Copyright © 2023 9IELTS. All Rights Reserved.

This site uses cookies to offer you a better browsing experience. By continuing to use this website, you agree to our Privacy Policy.