» You should spend about 20 minutes on this task.
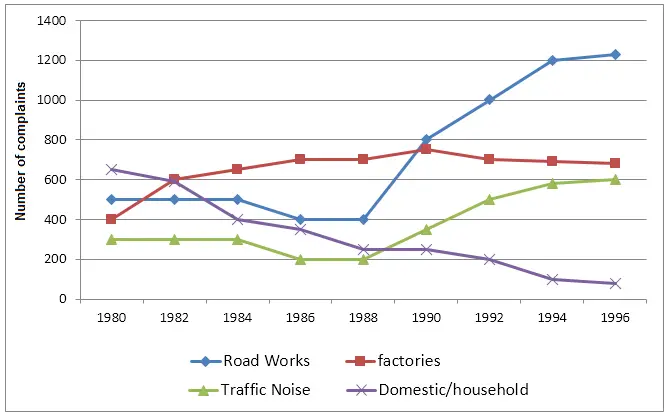
The graph below shows the number of complaints made about noise to Environmental Health authorities in the city of Newtown between 1980 and 1996. Summarise the information by selecting and reporting the main features, and make comparisons where relevant.
» Write at least 150 words.
Sample Answer 1
The line graph provides data on the complaints on noise filed to the Newton’s Environmental Health authorities from 1980 to 1996. Overall, the number of complaints made about four noise sources increased over the 16-year period except for domestic noise, which actually declined.
In details, Environmental Health authorities in Newtown received over 600 household noise-related objections in 1980 and that was the highest among the four categories of noise complaints this year. Complaints about domestic noise kept on steadily declining with a few minor fluctuations till it hit the trough of just around 100 complaints, the lowest in 1996.
Complaints lodged about traffic and roadwork noises showed a similar trend – both were almost steady till 1998 and then soared rapidly afterwards. Traffic blare was responsible for about 300 complaints, 200 fewer than that of road works, both of which remained unchanged till 1984 and then dropped to 200 and 300 respectively between 1986 and 1988. The number of objections about both types of cacophony surged to the highest point in 1996, with over 1200 complaints about road works and 600 about traffic noise. In particular, 1200 complaints were the highest number on the recorded objections made to authorities during the whole period.
Now turning to the complaints people made to authorities regarding noises from factories, it was just 400 in 1980. It then rose to 700 in 1986, and afterwards, it levelled off with minimal oscillation till 1996 when around 650 complaints were lodged.
[Author – Vanessa]
Sample Answer 2
The line graph shows the number of complaints received by the Environmental Health Department according to the type of noises heard in the city of Newtown. Overall, the number of complaints lodged about four noise sources increased over the period except for domestic noise, which, in fact, declined.
The four types of commotions the authorities have received the most complaints about are ‘road works’, ‘traffic noise’, ‘factories’ and ‘domestic or household disturbances’. In 1980, the authorities received over 600 complaints concerning domestic disturbances which have steadily decreased over the years. Factory noise was also on a steady increase from 1980 till it stabilised between 600 and 800 complaints per year from 1986 onwards. The two most noise complaints the authorities have received are from road works and traffic noise as both have either doubled or tripled from 1980 onwards. Noise complaints from residents in Newtown had steadily increased and reached to highest in 1986 with around 2600 complaints.
[ Written by – Veronica Gee ]
Sample Answer 3
The line graph compares the number of noise complaints to Environment Health authorities made by people in Newtown city between 1980 and 1996. Generally speaking, the highest number of complaints to Environments Health authorities were related to road works.
In 1980, the traffic noise started from 300 complaints per year and it stabilises until it plummeted to a low point of 200 in 1986 till 1988, then it made a peak in 1992 and continued to rose steadily until the end of 1996. On the other hand, the number of complaints about heavy industries started its growth from 400 complaints in 1980 and had steeply increased three years on, since that time it remained reasonably stable during the next 13 years.
Although road works started at a high point of 600 at the beginning of 1980, from 1980 onwards it declined steadily to a point of 70, respectively. However, it fluctuated slightly through the time between 1982 and 1996. It can be seen that the domestic household had a bigger complaints amount at the end of 1996 of point 1200, even though it began at 500 in 1980.
[ Written by – Lina Issa ]