• E-mail: [email protected]
  • Listening
    • Cambridge IELTS Tests
    • IELTS Practice Tests
    • Recent Actual Tests
  • Reading
    • Cambridge IELTS Tests
    • IELTS Practice Tests
    • Recent Actual Tests
  • Speaking
    • Speaking Part 1
    • Speaking Part 2
    • Speaking Part 3
  • Writing
    • General Training Writing Task 1
    • Academic Writing Task 1
      • Bar Chart
      • Line Graph
      • Pie Chart
      • Table
      • Map
      • Process Diagram
      • Mixed Charts
    • IELTS Writing Task 2
      • Advantages & Disadvantages Essays
      • Agree or Disagree Essays
      • Discuss Both Views Essays
      • Direct Questions Essays
      • Problems/Causes & Solutions Essays
  • Grammar
  • Vocabulary
    • Speaking Vocabulary
    • Writing Vocabulary
    • Collocation for IELTS
  • IELTS Books
  • Blog
No Result
View All Result
No Result
View All Result
Home IELTS Writing

Data on the spending and consumption of resourses

9IELTS by 9IELTS
October 15, 2022
in IELTS Writing, Academic Writing Task 1, Pie Chart
Reading Time: 2 mins read
4
VIEWS

» You should spend about 20 minutes on this task.

The pie charts below give data on the spending and consumption of resources by countries of the world and how the population is distributed.

Write a report for a university lecturer describing the information shown below.

» Write at least 150 words.

Data on the spending and consumption of resourses

Sample Answer

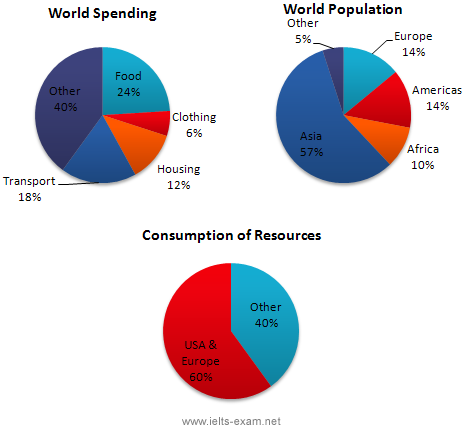
The given pie charts show data on world population, the spending of people in basic needs and their share of resource consumption. As is presented in the graph, people of the world spent most of their amount for their foods and more than half of the population lives in Asia whereas more than half of the resources are consumed by the USA and European people.

According to the first pie chart, people of the world on an average spent 24% on foods. In clothing, they spent 6% while this percentage is double for housing and triple for the transport. The remaining 40% is the combination of other categories for spending. The second pie chart shows that more than half of the world populations live in Asia continent while Europe & America have both only 14% of the total population. One-tenth of the world population lives in Africa and rest of the 5% people live in other places of the world. Finally, the third pie chart shows that though that 60% of world resources are consumed by the population of USA and Europe though their percentage is only 28% in total. The remaining 40% resources are shared among the rest of the 72% world population of other regions of the world.

Previous Post

Differences in wheat exports over three different areas

Next Post

Favourite Pastimes in different countries

Leave a Reply

Your email address will not be published. Required fields are marked *

POPULAR POSTS

How the prices of apples and oranges changed

Government spends about £220 million a year supporting museums

Write a letter to your friend exlaining that you are not able to help this time

You are employed full-time and also doing a part-time evening course

What many people eat in western countries is unhealthy

Parents need not to read or tell stories to children

IELTS Listening Practice Test 34

Laws should not be rigid or fixed

IELTS Reading Practice Test 179

IELTS Listening Practice Test 50

About Us

9IELTS

9IELTS is dedicated to providing free materials and resources for IELTS conquerors. Stay constantly updated with a wide range of ultimate tips, strategies, and practice tests to crack the high-stakes IELTS exam!

Recent Posts

Describe a hobby that someone in your family has

It is pointless to try and keep traditional skills and ways of life alive

The government has announced that it plans to build a new university

Write him a letter telling him something about herself

Describe a handmade gift you gave to a friend or relative

Disclaimer

The information on this site is for informational purposes only. IELTS is a registered trademark of the University of Cambridge ESOL, the British Council, and IDP Education Australia. This site and its owner are not affiliated, approved or endorsed by University of Cambridge ESOL, the British Council, or IDP Education Australia.
  • About Us
  • Contact Us
  • Disclaimer
  • Terms & Conditions
  • Privacy Policy

Copyright © 2023 9IELTS. All Rights Reserved.

No Result
View All Result
  • Listening
    • Cambridge IELTS Tests
    • IELTS Practice Tests
    • Recent Actual Tests
  • Reading
    • Cambridge IELTS Tests
    • IELTS Practice Tests
    • Recent Actual Tests
  • Speaking
    • Speaking Part 1
    • Speaking Part 2
    • Speaking Part 3
  • Writing
    • General Training Writing Task 1
    • Academic Writing Task 1
      • Bar Chart
      • Line Graph
      • Pie Chart
      • Table
      • Map
      • Process Diagram
      • Mixed Charts
    • IELTS Writing Task 2
      • Advantages & Disadvantages Essays
      • Agree or Disagree Essays
      • Discuss Both Views Essays
      • Direct Questions Essays
      • Problems/Causes & Solutions Essays
  • Grammar
  • Vocabulary
    • Speaking Vocabulary
    • Writing Vocabulary
    • Collocation for IELTS
  • IELTS Books
  • Blog

Copyright © 2023 9IELTS. All Rights Reserved.

This site uses cookies to offer you a better browsing experience. By continuing to use this website, you agree to our Privacy Policy.