» You should spend about 20 minutes on this task.
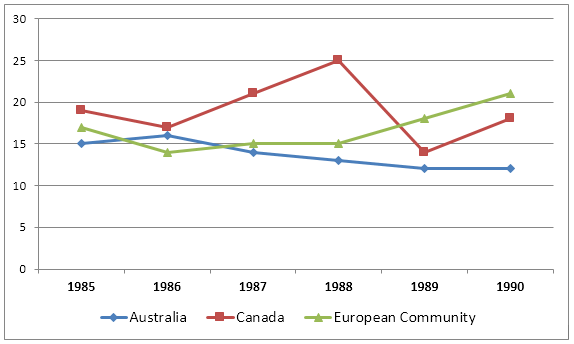
The graph below shows the differences in wheat exports over three different areas.
Write a report for a university lecturer describing the information shown below.
» Write at least 150 words.
Wheat Exports from 1985 to 1990 (in million tonnes)
Sample Answer 1
The given line graph compares the wheat exports over three different parts of the world namely Australia, Canada and the European Community from 1985 to 1990. As is presented in the graph, the wheat export in Australia decreased over time while the export in Canada and European countries increased with some fluctuations.
According to the graph, around 15 to 20 million tons of wheat was exported to Australia, Canada and the European community. This amount decreased slightly in 1986 reaching around 15 million tons and from that point, the export quantity in Australia kept on decreasing and reached just over 10 million tons in 1990. In the meantime, the amount increased sharply in Canada until 1988 and then there was a quick decline and finally, it reached around 19 million tons in 1990. Finally, the wheat export in the European Community increased gradually over the years and reached over 20 million tons in 1990.
Sample Answer 2
The line graph elucidates the wheat exportation of three regions, namely Canada, Australia and European community from 1985 to 1990. As can be seen, Canada was the leader in wheat trading till 1988 and after that, the European Community became the leading wheat exporter among the given regions.
Initially, in 1985, Canada exported the highest quantity of wheat which was approximately 19 million tonnes. The wheat export in this year by the European Community was about 17 million tonnes and finally, 15 million tonnes of wheat was traded by Australia in this year. Next year, only Australia managed to export more wheat than the previous year’s quantity, while it declined in the case of Canada and the European Community. In the next two years (1987 and 1988) the amount of wheat exported by Canada rocketed and reached to 25 million tonnes while it was 15 million tonnes for the European Community and far less for Australia. In 1989, the amount of wheat export by Canada dropped very sharply while it was quite the opposite for the European Community. The final year’s export figure shows that European Community shipped just over 20 million tonnes of wheat compared to Canada’s just below 20 million tonnes. In this year Australia consigned just over 10 million tonnes of wheat.
[Written by Max Frame]
Sample Answer 3
The line graph compares the quantity of wheat Australia, Canada, and the European Community exported between 1985 and 1990. Overall, the European Union’s wheat shipping increased over the time while Australia experienced a downward trend in its wheat trading. Although wheat exports of the three given areas have fluctuated, Canada had the most noticeable oscillations throughout the given period.
The European Union exported approximately 17.5 million tonnes of wheat in 1985 and the export fell below 15 million tonnes in the following year. Then, it increased to 15 million tonnes in the subsequent year and remained steady in 1988. EU’s wheat export surged in the next two years and in 1990 their wheat export was more than 20 million tonnes.
On the other hand, Australia’s wheat export in 1985 was the lowest, 15 million tonnes, among the given three regions. In the year that followed, the import improved with at least 1 million tonnes before it continuously declined in the subsequent years, hitting the lowest wheat export figure as little as 12 million tonnes in 1990.
Canada’s wheat export was the highest of the three given regions in 1985 with nearly 20 million tonnes. Next year, it decreased to about 17 million tonnes before it significantly increased in the following two years, reaching 25 million tonnes in 1988, the highest. However, in 1989, it plunged to around 5 million tones below its initial wheat exports figure in 1985 and settled to 20 million tones and the end of the period.
[Written by – Lance Calderon]
Sample Answer 4
The line graph illustrates changes in wheat export by Australia, Canada, and the European Community within a five-year period – from 1985 to 1990. Overall, what stands out of the graph is that wheat export by the European Community increased over the period, whereas Australia witnessed a gradual decrease in the period considered. Although wheat exports of the three areas fluctuated, Canada had the highest oscillations throughout the interim.
One of the first things to note is that Canada was the country whose wheat exportation comprised nearly 20 million tons in 1985. In the following year, the rate of export fell and then quickly recovered reaching a peak of 25 million tons in 1988. However, this figure fluctuated over the years, finishing surprisingly the same as it was at the starting point.
European Community initially exported less than Canada, but its outcome turned out more than the other two countries at the final point- over 20 tons. In contrast to the other two areas, Australia exported 15 tons in 1985 and saw a slight decrease over the period except in 1986.
[Writtne by – Nilufar Makhsudova]