» You are advised to spend about 20 minutes on this task.
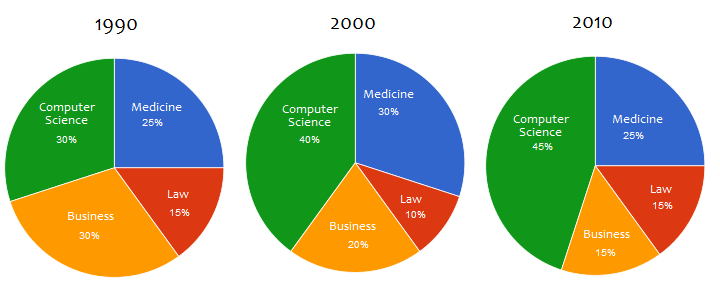
The charts below show degrees granted in different fields at the National University in the years 1990, 2000, 2010. Summarise the information by selecting and reporting the main features, and make comparisons where relevant.
» You should write at least 150 words.
Degrees Granted at the National University.

Sample Answer 1
The provided pie charts compare four different degrees that were awarded to the students at the National University in three decades, commencing from 1990. As can be seen, more students were granted Computer Science degrees while Business graduates decreased over the time.
The illustration indicates that both Business and Computer Science diplomas were achieved by 30% students in 1990 at the National University. The remaining 40% diplomas went to Medicine and Law graduates with a ration of 5: 3. After 10 years, the National University handed over 40% degrees to Computer Science students and 30% to Medicine students. Total students who achieved Business degrees in this year reduced by 10% while it was a 5% drop for the Law graduates. Finally, in 2000, the percentage of Computer Science graduates climbed to 45% in this institution. One-fourth diplomas were given to the Medicine students in this same year while the remaining 30% graduates were from the Business and Law departments with 15% from each faculty.
In summary, more degrees were awarded to the Computer Science graduates in the National University and there was a significant decrease in the number of Business graduates in 2000.
[Written by – Celine Moore]
Sample Answer 2
Three pie charts provided show academic records in 1990, 2000 and 2010 about the degrees that were granted in different fields at the National University. There were four majors given in those particular years – Computer Science, Medicine, Business and Law.
In 1990, Computer Science and Business graduates were equally granted, which were 30% for both programmes. In this year 25% of graduates from National University were from Medicine and 15% from the faculty of Law. In the following years, both in 2000 and 2010, Computer Science graduates increases steadily and their percentage increased to 40% in 2000 and 45% in 2010. Unfortunately, business faculty graduates dropped by 10% in 2000 and this decline was 5% for Law graduates. However, Medicine faculty graduates increased by 5% in 2000 but again went back to 25% in the year 2010.
As the data depicts, Computer Science became more popular over time and the highest percentage of graduates were granted in the given years from this major. Law and Medicine faculty remained almost the same in terms of granting of graduation degree, but the popularity and percentages of graduation from Business department decreased over time.
[Written by – Oktifani]
Sample Answer 3
The information regarding the awarded degrees in four different fields by National University in the span of three decades has been depicted in the pie charts.
The significant feature of this graph portrays that maximum degrees were granted in computer science field by National University as its proportion was accounted for 45% in 2010 which had increased gradually from 30% since 1990. Moving further to business stream, the percentage of awarded degrees was noticed as 30% in 1990 which led to a decline of 10% during 2000. Then, it descended slightly to 15% in 2010.
An identical pattern was followed by the ratio of awarded degrees in both law and medicine departments. In the case of Medicine department, the proportion of granted degrees was almost a quarter during 1990 and 2010, however, the proportion was 30% in 2000. Moreover, the percentage of granted degrees in law was the lowest, 10% in 2000 and slightly higher in other two decades.
Hence, it can be deduced that more students graduated from computer science from National University than they did from other faculties.
