» You should spend about 20 minutes on this task.
The graph shows estimated oil production capacity for several Gulf countries between 1990 and 2010.
Summarise the information by selecting and reporting the main features, and make comparisons where relevant.
» You should write at least 150 words.
Oil Production Capacity, millions of barrels per day (estimated)
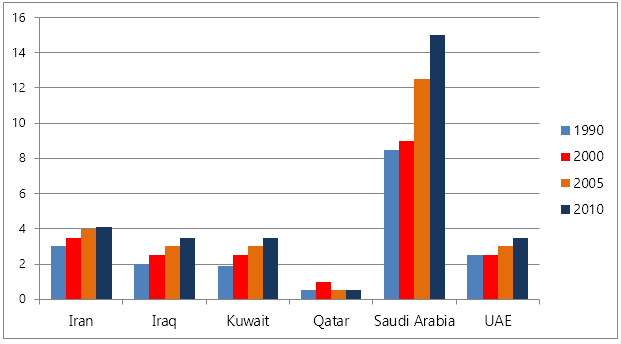
[Figure: Millions of Barrels per day]
Sample Answer 1:
The column graph compares probable oil production capabilities of six Gulf countries from 1990 to 2010. Overall, Saudi Arabi was the leading oil generating country and its production increased faster than the remaining five countries.
As is presented, the estimated oil producing capability in Iran in 1990 was around 3 million barrels each day which reached to 4 million after 15 years and finally in 2010, the production slightly improved. Iraq’s oil generating capability was slightly lower than that of Iran and its oil stock in 1990 was roughly 2 billion barrels per day and it almost doubled in 2010. Kuwait, on the contrary, produced less than 2 billion barrels daily and their production amount stool at approximately 3.5 million in 2010.
Moreover, Qatar, throughout the decades, produced the lowest oil which accounted for roughly 0.5 million barrels each day and after two decades, its production level remained at the same level. Oil generation per day in the United Arab Emirates showed a similar pattern that of Iraq and its production reached to nearly 4 million barrels in 2010.
Finally, Saudi Arabia’s oil generating level was the highest and significantly higher than that of other countries. In 1990, it produced over 8 million barrel daily which was approximately four times higher than that of other countries. Its daily production soared to well over 14 million barrel and this was marginally the same as the cumulative oil productions of other five countries.
[Written by – Jonathon]
Sample Answer 2:
The bar chart compares the daily oil production in five Gulf countries between 1990 and 2010. Overall, oil generation in Saudi Arabia was the highest and Iran, Iraq, Kuwait and the UAE produced nearly the same amount of oil.
As the diagram suggests, Saudi Arabia produced over 8 million barrels oil per day in 1990 which was the highest. Its production went as high as 15 million daily after 2 decades. It is worth noticing that, Saudi Arabia’s oil stock was somewhat similar to the rest of the countries collectively.
Oil generating capacity in Iran, Iraq, Kuwait and the UAE was almost the same in 1990, around 2-3 million barrels daily. Over the time their production capacity developed and reached to around 4 million barrels in 2010. Iran’s production was marginally higher than that of Iraq, Kuwait and the UAE.
The least amount of oil production could be observed in Qatar, less than 1 million barrel in 1990 and this capacity remained exactly the same there except in 2000 when its production slightly progressed.
Sample Answer 3:
The given illustration compares oil production capacity of several Gulf countries namely Iran, Iraq, Kuwait, Qatar, Saudi Arabia and the UAE between 1990 and 2010. As is presented in the diagram, Saudi Arabia had the highest capacity of oil production and its production increased significantly.
Initially, in 1990, Iraq & the UAE produced over 2 million barrels of oil per day whereas the production for Iran was 3 and for Kuwait and Qatar were less than 2 million Barrels. Saudi Arabia was the highest oil producing country that produced more than 8 million barrels daily in 1990. After 10 years, the oil production grew for all the countries except the UAE, where the production was same as it was a decade earlier. The trends of more oil production remained the same in all countries in 2005 except in Qatar.
Finally, in 2010, Iran produced more than 4 million barrels daily, for Iraq, Kuwait & the UAE the production was nearly 4 million barrels. Saudi Arabia produced much more oil than other Gulf countries as it did for all the mentioned years and this in 2010 it was almost 15 million barrels per day.