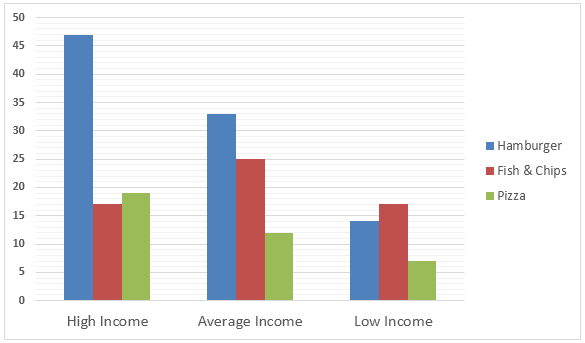
The Bar graph below shows the Expenditure in Million Pounds on fast food items by income groups in the UK.
Write a report for a university lecturer describing the information below.
» You should spend about 20 minutes on this task.
» You should write at least 150 words.
Expenditure on Fast Foods (in Million Pounds) by Income Groups, UK 1990
Model Answer 1:
The column graph compares how much money British citizens with different economic status spent on three fast food items in 1990. Overall, high and average income class British spent more amount on hamburgers and low-income class preferred to eat fish & chips as their spending pattern suggests.
As is presented in the diagram, rich people spent the highest amount on purchasing hamburgers, around 47 million Pounds, and their expenses for fish & chips and pizza were between 17 to 19 million. Interestingly, Average-income class spent more money on fish & chips than rich customers did. They spent exactly 25 millions on fish & chips though their highest amount went on hamburgers, roughly 33 million. Though rich British spent more on pizza than that of fish & ships, average-income class in Britain did the opposite. Finally, low-income class people spent a considerably fewer amount on fast food and their most preferred item was fish & chips for which they spent around 17 million Pound. Their spending on hamburgers was less than 15 million while they spent the least amount on pizza, which amounted to nearly 7 million Pounds.
Sample Answer 2:
The given bar graph shows data on the expenses made by the United Kingdom citizens for the fast food item in 1990. As is observed from the given data, people with high-income group spent more money on fast foods and the hamburger was the most preferred food among the high and average earning people.
According to the bar graph, the people who had high income did the maximum expense on the fast food items. Hamburger was the most preferred fast food items both for the average and high earning group people. More than 40 million pounds was expensed by the high earning people in this single fast food items. Two other popular fast food items among the high earning people were Pizza and Fish/ Chips for which the high earners expensed more than 15 million pounds in 1990.
Among the average earning people, the second most favourite fast food item was fish/ chips for which they made an expense of 25 million pounds in this year. On the other hand, Pizza was the least popular item among the people of low income and they preferred fish/ chips and hamburger over the pizza.
Model Answer 3:
The given bar graph compares the British expenditure on fast food based on the citizens’ income class in 1990. As is seen from the given illustration, high-income class British spent more on fast food items and the hamburger was their preferred item.
As is clear from the given diagram, high-income class British citizens spent more on fast food in 1990 than the average and low-income class citizens. High-income class people spent more than 40% on hamburger which is just over 30% for average income class and below 15% for low-income class. Interestingly average income class spent more on fish & chips and that shows that it is their favourite fast food item. They spend one-fourth of their total fast-food expenses on fish & chips while it was just above 15% both for the two other income classes. It is obvious that fish and chips are also popular among the low-income class as they spend their highest percentage on this item. Finally, the high-income class spent the highest amount on the pizza which was just below 20%. The pizza was least popular among the low and average income class British.