» You should spend about 20 minutes on this task.
The bar charts below show the prevalence of obesity among boys and girls aged 12 to 19 years by ethnicity, in the United States for the years 2004 and 2014. Summarise the information by selecting and reporting the main features, and make comparisons where relevant.
Write at least 150 words.
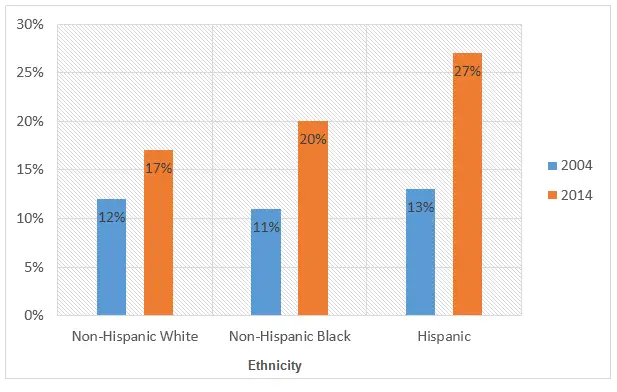
Prevalence of obesity among boys aged 12-19 years, by
ethnicity; United States, 2004 and 2014.

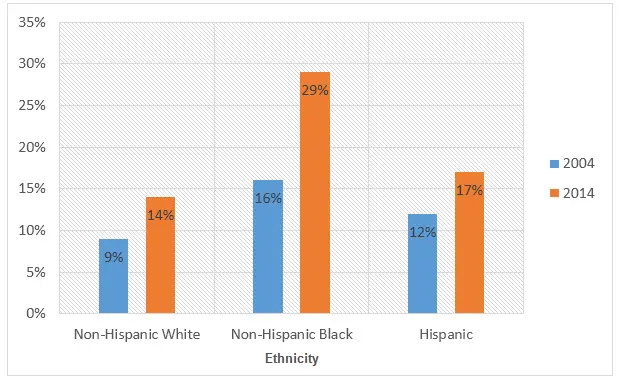
Prevalence of obesity among girls aged 12-19 years, by
ethnicity; United States, 2004 and 2014.

Source: www.cdc.gov
Sample Answer
The bar graphs reveal data on obesity rates among the US boys and girls between 12 and 19 years in 2004 and 2014 based on their demographics. Overall, more Hispanic boys suffered from obesity while this rate was higher among the Non-Hispanic black girls.
According to the first column graph, more than one out of ten Non-Hispanic white boys who aged between 12 and 19 were corpulent in 2004. A similar percentage of boys who were Hispanic or Non-Hispanic blacks suffered from the same problem. On the contrary, 9% girls of this age group from the Non-Hispanic US citizens were overweight, slightly less than that of boys from the same ethnicity. However, the obesity rate among Non-Hispanic black girls was the highest, 16% in this year, which was 5% higher than that of boys from the same ethnic group and 7 and 4 percent higher than that of white and Hispanic girls respectively.
After a decade, the percentage of obese Hispanic boys increased to 27% which was a 14% rise. Every one in five Non-Hispanic boys were overweight in 2014 which was slightly more than that of while boys. Finally, the rate of obesity among Non-Hispanic girls swelled to 29%, a 13% rise, which was higher than that of other ethnic girls. Evidently, more Hispanic boys and Non-Hispanic girls, 27 and 29% consecutively, were obese in the US in 2014 than boys and girls of other ethnicity.
