• E-mail: [email protected]
  • Listening
    • Cambridge IELTS Tests
    • IELTS Practice Tests
    • Recent Actual Tests
  • Reading
    • Cambridge IELTS Tests
    • IELTS Practice Tests
    • Recent Actual Tests
  • Speaking
    • Speaking Part 1
    • Speaking Part 2
    • Speaking Part 3
  • Writing
    • General Training Writing Task 1
    • Academic Writing Task 1
      • Bar Chart
      • Line Graph
      • Pie Chart
      • Table
      • Map
      • Process Diagram
      • Mixed Charts
    • IELTS Writing Task 2
      • Advantages & Disadvantages Essays
      • Agree or Disagree Essays
      • Discuss Both Views Essays
      • Direct Questions Essays
      • Problems/Causes & Solutions Essays
  • Grammar
  • Vocabulary
    • Speaking Vocabulary
    • Writing Vocabulary
    • Collocation for IELTS
  • IELTS Books
  • Blog
No Result
View All Result
No Result
View All Result
Home IELTS Writing

Global population figures and figures for urban populations

9IELTS by 9IELTS
November 5, 2022
in IELTS Writing, Academic Writing Task 1, Mixed Charts
Reading Time: 2 mins read
5
VIEWS

» You should spend about 20 minutes on this task.

The graphs below provide information on global population figures and figures for urban populations in different world regions. Summarise the information by selecting and reporting the main features, and make comparisons where relevant.

» Write at least 150 words.

global-population-figures-and-figures-for-urban-populations
World Population Growth 1800 – 2100

Sample Answer 1

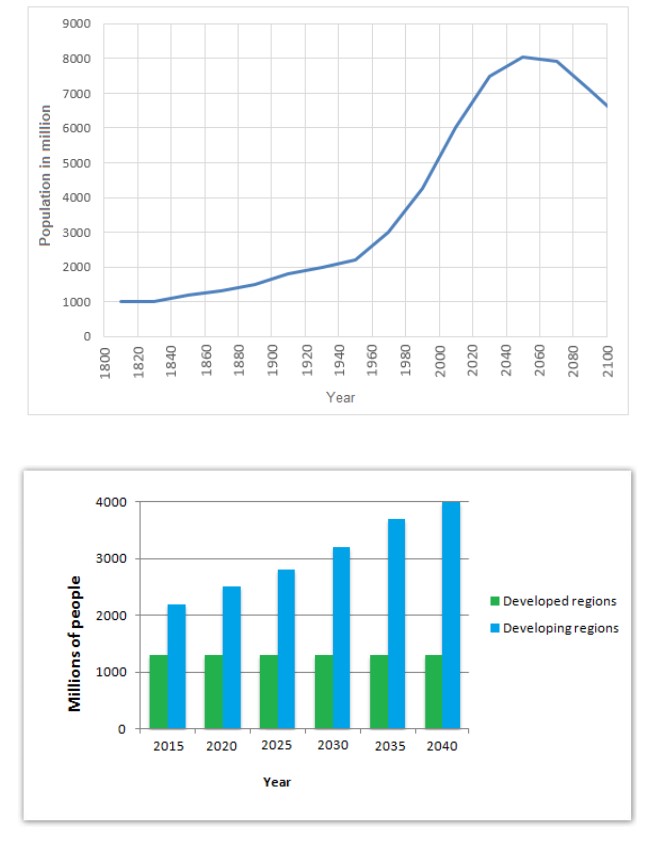
The given illustrations show information on the world population from 1800 to 2100 (with projection) and the distribution of this population in developed and developing regions.

According to the first graph, from 1800 to 1920, the global population was less than 2000 million, with a slight increase. But after 1940, this population boomed and reached to 6000 million in the year 2000. The graph shows the projection that this rapid growth o population would continue till 2050 when the population would reach to over 8000 million. But after that, the global population will decrease and will fall to around 6000 million in the year 2100 according to the projection.

According to the second graph, around 1200 million people lived in the developed regions in 2015 and the population in this part would remain almost the same till 2040. On the contrary, the population of the developing country will keep increasing and would reach to 4000 million in 2040 compared to the initial population of 2100 million in 2015.

In summary, the global population will keep on increasing till 2050 and this increase would be more on developing regions than the developed regions. After 2050, it is projected that the total population of the world will decrease.

Sample Answer 2

The provided illustrations show information on the world population from 1800 to 2100 and the distribution of this population in developed and developing regions.

As per the line graph, the global population increased comparatively slowly from 1800 to 1940 and reached over 2000 million in 1940. This was followed by a drastic rise to 6000 million by the year 2000. The graph shows the projection that this rapid growth of population will continue until 2050 when the population would be over 8000 million. However, after that, it would fall to around 6000 million in 2100. According to the bar graph, around 1200 million people lived in developed countries in 2015 and this figure would remain unaffected until 2050. On the contrary, over 2000 million lived in developing countries in 2015 and the population in these areas are expected to be double by the year 2040.

Overall, the global population would continue to rise until 2050 and the majority of the people would be living in developing regions while the population in the developed countries will remain almost the same.

Previous Post

Number of children ever born to women aged 40-44 years in Australia

Next Post

The division of household tasks by gender in Great Britain

Leave a Reply Cancel reply

Your email address will not be published. Required fields are marked *

POPULAR POSTS

The employment rates across 6 countries in 1995 and 2005

Should we discourage people to use cars

Consumption of energy in the USA since 1980 with projections

People work hard to buy more things in life

It is more important for students to study history and literature than it is for them to study science and mathematics

Proportion of families living in poverty in Australia

Write to the shop owner describing what you need and asking whether they have these items and what they cost

Describe an important holiday that is celebrated in your country

When students are in large classes it is very hard for the teachers

Destinations of holiday makers from a particular Asian country

About Us

9IELTS

9IELTS is dedicated to providing free materials and resources for IELTS conquerors. Stay constantly updated with a wide range of ultimate tips, strategies, and practice tests to crack the high-stakes IELTS exam!

Recent Posts

IELTS Reading Practice Test 180

IELTS Reading Practice Test 19

IELTS Speaking Part 3: Topic 42

IELTS Reading Practice Test 124

The amount of money per week spent on fast foods in Britain

Disclaimer

The information on this site is for informational purposes only. IELTS is a registered trademark of the University of Cambridge ESOL, the British Council, and IDP Education Australia. This site and its owner are not affiliated, approved or endorsed by University of Cambridge ESOL, the British Council, or IDP Education Australia.
  • About Us
  • Contact Us
  • Disclaimer
  • Terms & Conditions
  • Privacy Policy

Copyright © 2023 9IELTS. All Rights Reserved.

No Result
View All Result
  • Listening
    • Cambridge IELTS Tests
    • IELTS Practice Tests
    • Recent Actual Tests
  • Reading
    • Cambridge IELTS Tests
    • IELTS Practice Tests
    • Recent Actual Tests
  • Speaking
    • Speaking Part 1
    • Speaking Part 2
    • Speaking Part 3
  • Writing
    • General Training Writing Task 1
    • Academic Writing Task 1
      • Bar Chart
      • Line Graph
      • Pie Chart
      • Table
      • Map
      • Process Diagram
      • Mixed Charts
    • IELTS Writing Task 2
      • Advantages & Disadvantages Essays
      • Agree or Disagree Essays
      • Discuss Both Views Essays
      • Direct Questions Essays
      • Problems/Causes & Solutions Essays
  • Grammar
  • Vocabulary
    • Speaking Vocabulary
    • Writing Vocabulary
    • Collocation for IELTS
  • IELTS Books
  • Blog

Copyright © 2023 9IELTS. All Rights Reserved.

This site uses cookies to offer you a better browsing experience. By continuing to use this website, you agree to our Privacy Policy.