»You should spend about 20 minutes on this task.
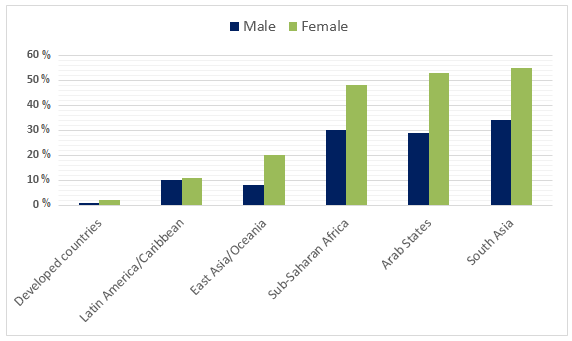
The chart below shows estimated world illiteracy rates by region and by gender for the year 2000.
Write a report for a university lecturer describing the information below.
»You should write at least 150 words.
Estimated World illiteracy rates, by region and gender, 2000.
Sample Answer 1:
The bar chart compares the ratio of uneducated population, divided by sex, in six regions of the world in 2000. Overall, illiteracy rates were the highest in Sub-Saharan Africa, Arab countries and South Asia and close to zero in developed nations. However, there were more illiterate women than men in all regions.
Men and women, unable to read or write, made up only 1% and 2% in developed countries. In comparison, the proportions of illiterate citizens in Latin America and the Caribbean were higher, 10% and 11%. In East Asia and Oceania, however, the gap was enormous; there were 20% illiterate females compared to 8% males.
As regards the other regions, Sub-Saharan Africa had much greater proportions of the unschooled population, 48% women and 30% men. A similar proportion was seen in Arab states, where illiteracy rates were 53% and 28% respectively for females and males. It is noticeable that more than half of their females and one-quarter males never received any formal education. However, South Asia stood out as having the worst illiteracy figures for both sexes; 55% females versus 34% males.
[Writtne by – Eynar Hajizadeh]
Sample Answer 2:
The column graph compares the illiteracy rates between both sexes in six regions of the world in 2000. A quick glance at the diagram reveals that more women were unlettered globally than that of men and the percentages of uneducated people in South Asia, Arab states and Sub-Saharan Africa parts were considerably higher than other parts of the world.
As is observed from the illustration, more percentages of women in different regions in the world were illiterate than that of men. Almost all of the citizens in the developed countries were literate in 2000 as the illiteracy rate in these countries was almost nill, 1-2 % to be more precise. The highest rate of illiteracy could be found in South Asia where more than half of women were not educated at all while more than one in every three males was also unschooled. Similar percentages of uneducated males and females could be found in the Arab and Sub-Saharan African regions and in all these regions the percentages of illiterate females were significantly higher than the uneducated males. On the contrary, the percentage of East Asian population who were literate was far higher than that of the South Asian population and yet the percentage of female illiteracy was more than double than that of males. Finally, the Latin America had around 10% unenlightened males and females and the gap between the unlettered males and females in this region was remarkably lower, similar to the developed countries.
[Written by Scott]
Sample Answer 3:
The given bar chart shows the approximate world illiteracy rates by gender and region for the year 2000. As is observed in the given column graph, in all cases, the illiteracy rate among women was higher than men. Developed countries had almost ignorable illiteracy rate. On the contrary, about half of the population in South Asia, Arab states and Africa were illiterate.
The illiteracy rate in Latin America / Caribbean and East Asia / Oceania was only 1 percent (approximately), 10 percent and 14 percent (approximately) respectively considering both male and female. Sub-Saharan Africa, the Arab States and South Asia had rates of approximately 40%, 41% and 45%. Illiterate women were higher than the illiterate men in all the given countries.
In the developed countries, the proportion of literacy among men and female was almost similar but the differences increased for Asia, Arab states and Africa. Among the given 6 countries, the South Asian population were far more illiterate than any other country.
(Approximately 163 words)
Sample Answer 4:
The given bar graph shows the illiteracy rates of different regions of the world both for male and female for the year 2000. As is observed from the graph, South Asian, Arab and African countries had a very high rate of illiteracy while this percentage was very low in developed countries as well as in the Latin American countries. Besides, it is also observed that female illiteracy rate was higher than male illiteracy rate in all part of the world.
As is presented in the graph, the illiteracy rate among female was higher than male in all parts of the world. The illiteracy rate in South Asian, Arab states and in Sub-Saharan Africa was alarmingly higher than any part of the world. More than 50 female in South Asian and Arab countries were illiterate while this percentage was only 1 in developed countries. Around 30% males were illiterate in these two regions while this percentage was less than 1 in developed countries. The illiteracy rate in Sub-Saharan African countries was similar to the South Asian and Arab countries. East Asia and Oceania had less than 20% illiterate people while this rate was around 10% in Latin America/ Caribbean countries. Finally, in developed countries, most of the people were literate as they had a very small percentage of illiterate people which amounted less than 1%.
In summary, the South Asian, Arabian and Sub-Saharan countries had a severe illiteracy rate compared to any part of the world and female illiteracy rate was higher than the male illiteracy rate all over the world.
(Approximately 258 words)