• E-mail: [email protected]
  • Listening
    • Cambridge IELTS Tests
    • IELTS Practice Tests
    • Recent Actual Tests
  • Reading
    • Cambridge IELTS Tests
    • IELTS Practice Tests
    • Recent Actual Tests
  • Speaking
    • Speaking Part 1
    • Speaking Part 2
    • Speaking Part 3
  • Writing
    • General Training Writing Task 1
    • Academic Writing Task 1
      • Bar Chart
      • Line Graph
      • Pie Chart
      • Table
      • Map
      • Process Diagram
      • Mixed Charts
    • IELTS Writing Task 2
      • Advantages & Disadvantages Essays
      • Agree or Disagree Essays
      • Discuss Both Views Essays
      • Direct Questions Essays
      • Problems/Causes & Solutions Essays
  • Grammar
  • Vocabulary
    • Speaking Vocabulary
    • Writing Vocabulary
    • Collocation for IELTS
  • IELTS Books
  • Blog
No Result
View All Result
No Result
View All Result
Home IELTS Writing

How much people in the United States and the United Kingdom spend on fue

9IELTS by 9IELTS
October 15, 2022
in IELTS Writing, Academic Writing Task 1, Line Graph
Reading Time: 2 mins read
2
VIEWS

You should spend about 20 minutes on this task.

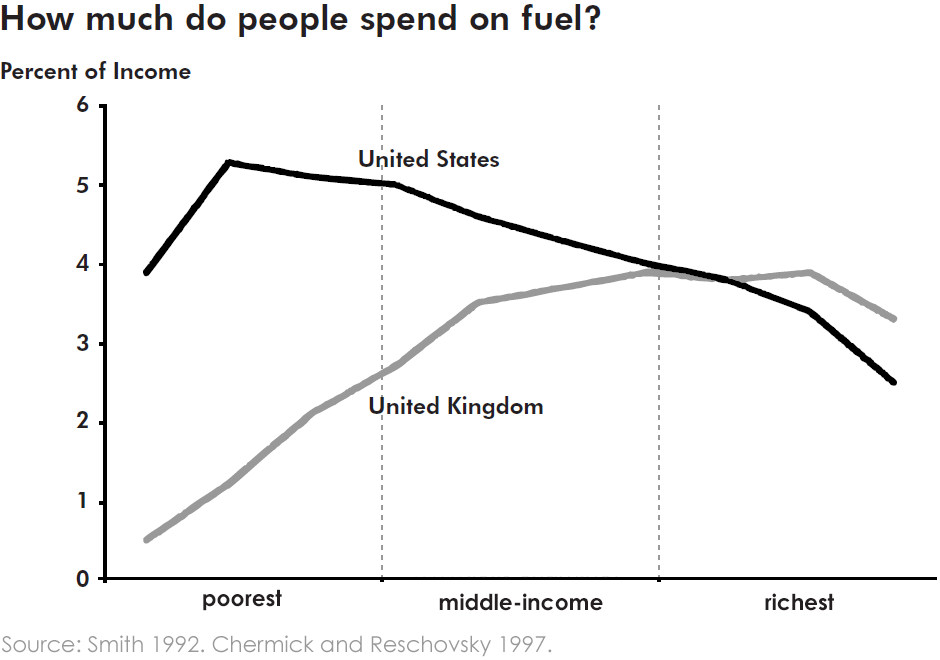
The graph below gives information about how much people in the United States and the United Kingdom spend on fuel. Summarise the information by selecting and reporting the main features, and make comparisons where relevant.

Write at least 150 words.
How much people in the United States and the United Kingdom spend on fue

Sample Answer

The graph compares the percentage income that people in the UK and USA spend on fuel.

Firstly, the difference between the total spending on fuel by the poorest and the richest is greater in the UK than in the USA. In the former, the poorest spend less than 0.5% of their income on fuel, suggesting that they do not use cars very much, and the richest spend around 3%. By contrast, in the US, the poorest spend around 4-5% while the richest spend between 2 and 3%.

Secondly, in the USA it is also noticeable that the percentage of income spent by the poor can be twice that spent by the rich. However, in the UK. the percentage spent rises quite steeply for the poorer members of the population but then remains almost constant apart from the very richest, where it falls again.

In both countries people on middle incomes spend about the same percentage. Overall, the percentage of income spent on fuel generally gets higher in the UK, whereas it decreases in the US.

(175 words)

Previous Post

Information about the manufacture of frozen fish pies

Next Post

The results of surveys about McGill University

Leave a Reply

Your email address will not be published. Required fields are marked *

POPULAR POSTS

Kiran Makkar’s Speaking Guesswork Jan-Apr 2023 First Version PDF

You have decided that you would like to apply to do a course at one of the colleges in this city

Describe a big company that you would like to work in

IELTS Reading Practice Test 167

Describe a club or association you have organised or involved in

IELTS Speaking Vocabulary: Environment

Describe your favourite colour

IELTS Reading Practice Test 249

IELTS Listening Practice Test 143

IELTS Speaking Part 3: Topic 56

About Us

9IELTS

9IELTS is dedicated to providing free materials and resources for IELTS conquerors. Stay constantly updated with a wide range of ultimate tips, strategies, and practice tests to crack the high-stakes IELTS exam!

Recent Posts

Describe a website that you bought something from

IELTS Reading Practice Test 275

You would like to suggest a place you have visited lately

Attempts must be made to encourage people to use their cars less

Stages and equipment used in the cement-making process

Disclaimer

The information on this site is for informational purposes only. IELTS is a registered trademark of the University of Cambridge ESOL, the British Council, and IDP Education Australia. This site and its owner are not affiliated, approved or endorsed by University of Cambridge ESOL, the British Council, or IDP Education Australia.
  • About Us
  • Contact Us
  • Disclaimer
  • Terms & Conditions
  • Privacy Policy

Copyright © 2023 9IELTS. All Rights Reserved.

No Result
View All Result
  • Listening
    • Cambridge IELTS Tests
    • IELTS Practice Tests
    • Recent Actual Tests
  • Reading
    • Cambridge IELTS Tests
    • IELTS Practice Tests
    • Recent Actual Tests
  • Speaking
    • Speaking Part 1
    • Speaking Part 2
    • Speaking Part 3
  • Writing
    • General Training Writing Task 1
    • Academic Writing Task 1
      • Bar Chart
      • Line Graph
      • Pie Chart
      • Table
      • Map
      • Process Diagram
      • Mixed Charts
    • IELTS Writing Task 2
      • Advantages & Disadvantages Essays
      • Agree or Disagree Essays
      • Discuss Both Views Essays
      • Direct Questions Essays
      • Problems/Causes & Solutions Essays
  • Grammar
  • Vocabulary
    • Speaking Vocabulary
    • Writing Vocabulary
    • Collocation for IELTS
  • IELTS Books
  • Blog

Copyright © 2023 9IELTS. All Rights Reserved.

This site uses cookies to offer you a better browsing experience. By continuing to use this website, you agree to our Privacy Policy.