Estimated world literacy rates by region and by gender for the year 2000
You should spend about 20 minutes on this task. The chart below shows estimated world literacy rates by region and by gender for...
You should spend about 20 minutes on this task. The chart below shows estimated world literacy rates by region and by gender for...
You should spend about 20 minutes on this task. In June 1996, an experimental flu vaccine was trialled in a large country town...

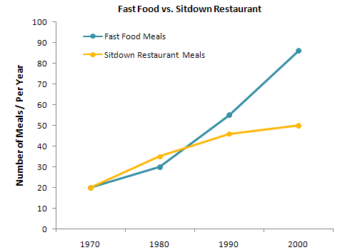
You should spend about 20 minutes on this task. The table below shows the sales at a small restaurant in a downtown business...
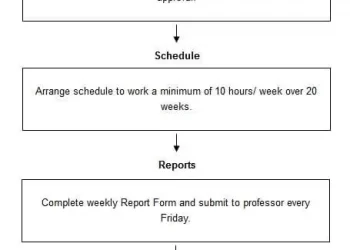
You should spend about 20 minutes on this task. The flowchart below shows the process involved in completing the work experience requirement for...
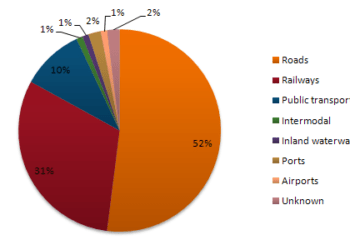
You should spend about 20 minutes on this task. The Bar Chart shows CO2 emissions for different forms of transport in the European...
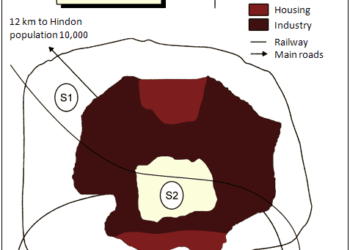
You should spend about 20 minutes on this task. The map below is of the town of Garlsdon. A new supermarket (S) is...
You should spend about 20 minutes on this task. The charts below show the percentage of their food budget the average family spent...
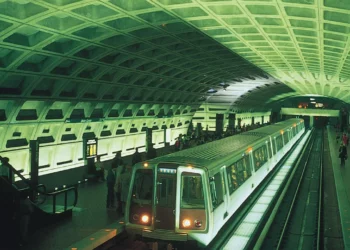
You should spend about 20 minutes on this task. The take below gives information about the underground railway systems in six cities. Summarise...
You should spend about 20 minutes on this task. The table below shows the proportion of different categories of families living in poverty...
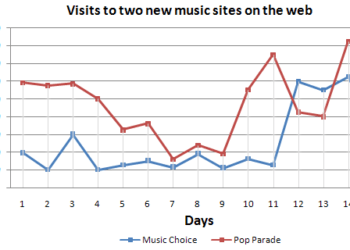
You should spend about 20 minutes on this task. The graph below compares the number of visits to two new music sites on...
9IELTS is dedicated to providing free materials and resources for IELTS conquerors. Stay constantly updated with a wide range of ultimate tips, strategies, and practice tests to crack the high-stakes IELTS exam!