• E-mail: [email protected]
  • Listening
    • Cambridge IELTS Tests
    • IELTS Practice Tests
    • Recent Actual Tests
  • Reading
    • Cambridge IELTS Tests
    • IELTS Practice Tests
    • Recent Actual Tests
  • Speaking
    • Speaking Part 1
    • Speaking Part 2
    • Speaking Part 3
  • Writing
    • General Training Writing Task 1
    • Academic Writing Task 1
      • Bar Chart
      • Line Graph
      • Pie Chart
      • Table
      • Map
      • Process Diagram
      • Mixed Charts
    • IELTS Writing Task 2
      • Advantages & Disadvantages Essays
      • Agree or Disagree Essays
      • Discuss Both Views Essays
      • Direct Questions Essays
      • Problems/Causes & Solutions Essays
  • Grammar
  • Vocabulary
    • Speaking Vocabulary
    • Writing Vocabulary
    • Collocation for IELTS
  • IELTS Books
  • Blog
No Result
View All Result
No Result
View All Result
Home IELTS Writing

Information on the percentage of Canadians gave money to charitable organisations by age range

9IELTS by 9IELTS
October 17, 2022
in IELTS Writing, Academic Writing Task 1, Bar Chart
Reading Time: 2 mins read
4
VIEWS

You should spend about 20 minutes on this task.

The chart below gives information on the percentage of Canadians gave money to charitable organisations by age range for the years 2000 and 2015. Summarise the information by selecting and reporting the main features, and make comparisons where relevant.

Write at least 150 words.
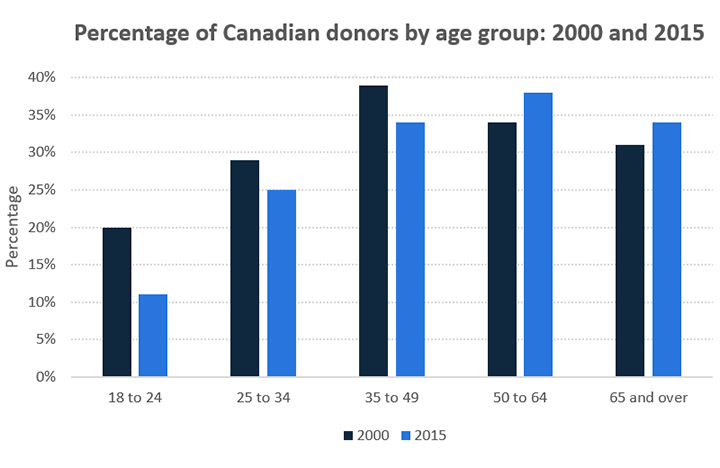
Information on the percentage of Canadians gave money to charitable organisations by age range

Sample Answer

The chart examines the levels of donation among people of different ages in Canada.

Overall, a greater proportion of Canadians gave money to charitable organisations in 2000 than in 2015. However, in terms of trends over time, the donor rate did not change in the same way among all age groups.

In 2000, the proportion of Canadians made charitable donations ranged from a high of 39% in the 35-to-49 age group to a low of 20% in the 18-to-24 age group. By 2015, these figures had fallen significantly to 34% and 11% respectively. The rate of donors among the population aged 25 to 34 also decreased from 29% in 2000 to 25% in 2015.

While the proportion of donors aged 18 to 49 declined between 2000 and 2015, the trend followed an opposite direction for older Canadians. For example, among people aged 50 to 64, the share of donors rose by 4% to nearly 38%, which was the highest percentage for 2015. The figure for older seniors aged 65 and over was lower than this, at 34%, but it was still a little higher than the 2000 figure of 31%.

(190 words)

Previous Post

Data on the manufacture of passenger cars in 2015

Next Post

The movement of people from rural to urban areas in three countries and predictions for future years

Leave a Reply

Your email address will not be published. Required fields are marked *

POPULAR POSTS

Text messaging using mobile phones is largely to blame for the falling standards in written English

Your friend has had her first book published

Commuters using different modes of transports in London

Describe a noisy place you have been to

IELTS Reading Recent Actual Test 16

Projections for global production by sector in 2040 and 2060

Why do you think teachers give homework to students

IELTS Reading Practice Test 92

Landlord’s workmen tried to fix problem but without success

IELTS Reading Practice Test 145

About Us

9IELTS

9IELTS is dedicated to providing free materials and resources for IELTS conquerors. Stay constantly updated with a wide range of ultimate tips, strategies, and practice tests to crack the high-stakes IELTS exam!

Recent Posts

The Hawaiian island chain in the centre of the Pacific Ocean

IELTS Speaking Part 1: Math

The diagram shows the manufacturing process for making sugar from sugar cane

Describe a family photograph you remember

IELTS Listening Practice Test 04

Disclaimer

The information on this site is for informational purposes only. IELTS is a registered trademark of the University of Cambridge ESOL, the British Council, and IDP Education Australia. This site and its owner are not affiliated, approved or endorsed by University of Cambridge ESOL, the British Council, or IDP Education Australia.
  • About Us
  • Contact Us
  • Disclaimer
  • Terms & Conditions
  • Privacy Policy

Copyright © 2023 9IELTS. All Rights Reserved.

No Result
View All Result
  • Listening
    • Cambridge IELTS Tests
    • IELTS Practice Tests
    • Recent Actual Tests
  • Reading
    • Cambridge IELTS Tests
    • IELTS Practice Tests
    • Recent Actual Tests
  • Speaking
    • Speaking Part 1
    • Speaking Part 2
    • Speaking Part 3
  • Writing
    • General Training Writing Task 1
    • Academic Writing Task 1
      • Bar Chart
      • Line Graph
      • Pie Chart
      • Table
      • Map
      • Process Diagram
      • Mixed Charts
    • IELTS Writing Task 2
      • Advantages & Disadvantages Essays
      • Agree or Disagree Essays
      • Discuss Both Views Essays
      • Direct Questions Essays
      • Problems/Causes & Solutions Essays
  • Grammar
  • Vocabulary
    • Speaking Vocabulary
    • Writing Vocabulary
    • Collocation for IELTS
  • IELTS Books
  • Blog

Copyright © 2023 9IELTS. All Rights Reserved.

This site uses cookies to offer you a better browsing experience. By continuing to use this website, you agree to our Privacy Policy.