• E-mail: admin@9ielts.com
  • Listening
    • IELTS Practice Tests
    • Recent Actual Tests
  • Reading
    • IELTS Practice Tests
    • Recent Actual Tests
  • Speaking
    • Speaking Part 1
    • Speaking Part 2
    • Speaking Part 3
  • Writing
    • General Training Writing Task 1
    • Academic Writing Task 1
      • Bar Chart
      • Line Graph
      • Pie Chart
      • Table
      • Map
      • Process Diagram
      • Mixed Charts
    • IELTS Writing Task 2
      • Advantages & Disadvantages Essays
      • Agree or Disagree Essays
      • Discuss Both Views Essays
      • Direct Questions Essays
      • Problems/Causes & Solutions Essays
  • Grammar
  • Vocabulary
    • Speaking Vocabulary
    • Writing Vocabulary
    • Collocations for IELTS
  • Books
  • Blog
No Result
View All Result
No Result
View All Result
Home IELTS Writing

The movement of people from rural to urban areas in three countries and predictions for future years

9IELTS by 9IELTS
July 31, 2022
in IELTS Writing, Academic Writing Task 1, Line Graph
Reading Time: 2 mins read
30
VIEWS

You should spend about 20 minutes on this task.

The chart below shows the movement of people from rural to urban areas in three countries and predictions for future years. Summarise the information by selecting and reporting the main features, and make comparisons where relevant.

Write at least 150 words.
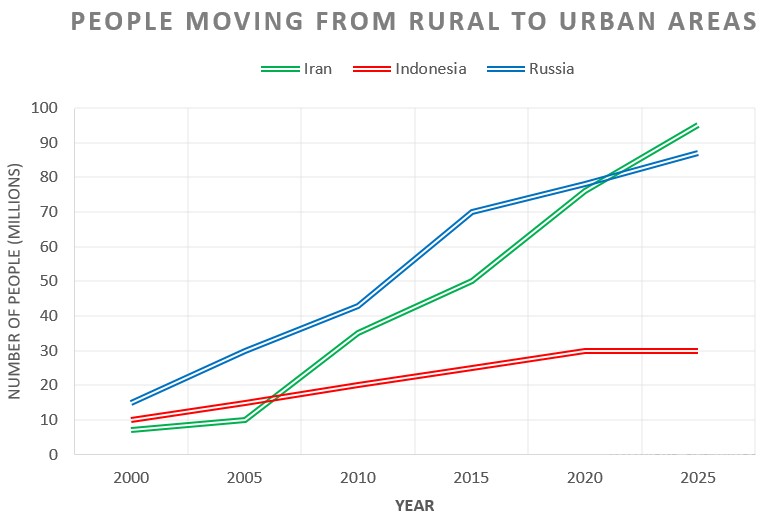
The movement of people from rural to urban areas in three countries and predictions for future years

Sample Answer

The line graph shows the figures in millions for the migration of people from the countryside to cities in three different countries over the period 2000 to 2025, including future predictions. Overall, it is clear that the shift from rural communities towards urban metropolitan areas is upwards.

All three countries began the period with similar numbers of urban migrants. Russia started with the most migrants (around 15 million) and over the period sees significant increases, particularly between 2010 and 2015 (around 42 to 70 million) with this upward trend predicted to continue (reaching approximately 86 million by 2025). Similarly, Iran after a slow start between 2000 and 2005 sees a dramatic rise in urban migration, and after 2015 is predicted to see an even more dramatic increase, surpassing Russia’s figures in 2020 reaching around 95 million by 2025. However, Indonesia bucks the trend somewhat. Whilst consistently steady between 2000 and 2020, its growth is far less dramatic than the other two countries (10 to 30 million). Furthermore, post 2020, it is predicted to level off at around 30 million.

To sum up, while all three countries have seen growth up to 2015, only the figures for countries Russia and Iran are predicted to see continued growth up to 2025.

(209 words)

Previous Post

Information on the percentage of Canadians gave money to charitable organisations by age range

Next Post

Employment figures in different tourism-related industries

Leave a Reply Cancel reply

Your email address will not be published. Required fields are marked *

POPULAR POSTS

Cambridge IELTS 1-19 Book Series [PDF + Audio]

Cambridge IELTS 20 Academic [Update 2025]

Cambridge IELTS 19 Academic [PDF + Audio]

200 IELTS Speaking Sample Answers [PDF + Audio]

Cambridge IELTS 18 Academic [PDF + Audio]

IELTS Recent Actual Tests [Full PDF + Audio]

IELTS Listening Practice Test 204

Cambridge IELTS 18 General Training [PDF + Audio]

IELTS Reading Practice Test 320

Cambridge IELTS 17 General Training [PDF + Audio]

About Us

9ielts logo

9IELTS is dedicated to providing free materials and resources for IELTS conquerors. Stay constantly updated with a wide range of ultimate tips, strategies, and practice tests to crack the high-stakes IELTS exam!

Recent Posts

Waste recycling rates in the U.S. from 1960 to 2011

A friend has invited you to her daughter’s birthday

Living in an apartment instead of a university dormitory

Describe a close friend you have

The age of the population of Iceland between 1990 and 2020

Disclaimer

The information on this site is for informational purposes only. IELTS is a registered trademark of the University of Cambridge ESOL, the British Council, and IDP Education Australia. This site and its owners are not affiliated, approved or endorsed by University of Cambridge ESOL, the British Council, or IDP Education Australia.
  • About Us
  • Contact Us
  • Disclaimer
  • Terms & Conditions
  • Privacy Policy

© 2024 9IELTS. All Rights Reserved.

No Result
View All Result
  • Listening
    • IELTS Practice Tests
    • Recent Actual Tests
  • Reading
    • IELTS Practice Tests
    • Recent Actual Tests
  • Speaking
    • Speaking Part 1
    • Speaking Part 2
    • Speaking Part 3
  • Writing
    • General Training Writing Task 1
    • Academic Writing Task 1
      • Bar Chart
      • Line Graph
      • Pie Chart
      • Table
      • Map
      • Process Diagram
      • Mixed Charts
    • IELTS Writing Task 2
      • Advantages & Disadvantages Essays
      • Agree or Disagree Essays
      • Discuss Both Views Essays
      • Direct Questions Essays
      • Problems/Causes & Solutions Essays
  • Grammar
  • Vocabulary
    • Speaking Vocabulary
    • Writing Vocabulary
    • Collocations for IELTS
  • Books
  • Blog

© 2024 9IELTS. All Rights Reserved.