You should spend about 20 minutes on this task.
The charts below show the Medical research funding amount in millions of Dollars in Someland and also shows the death number for this area.
Write a report for a university lecturer describing the information in the graphs below.
Write at least 150 words.


Sample Answer 1:
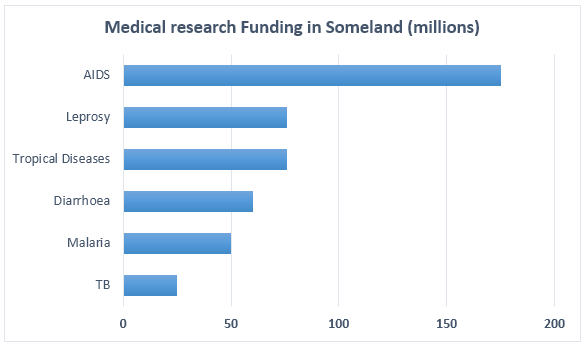
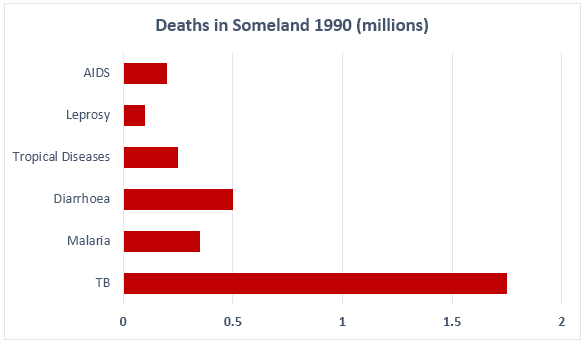
The graphs compare the number of deaths caused by six diseases in Someland in 1990 and the amount of research funding allotted to each of those diseases. It can be clearly seen that the amount of research funding in many cases did not correlate with the seriousness of the disease in terms of numbers of deaths.
In 1990, about 0.2 million people died from AIDS, 0.1 million from leprosy and 0.3 million from tropical diseases. The death count in this year in Someland was 0.5 million from diarrhoea, 0.4 million from malaria and 1.8 million deaths from TB. These figures can be contrasted with the amount of funding allocated for each disease. In 1990, 180 million dollars were used for researching ailments for AIDS, which was the highest amount. This year 80 million was spent for leprosy research, 79 million for tropical diseases, 60 million for diarrhoea. Somelander authority spent 50 million dollars for malaria research and allowed TB research 20 million dollars, the lowest amount in researching diseases.
In summary, it is clear that funding allocation for disease research in Someland is not wholly determined by the number of deaths for which each disease is responsible in a given year.
(This model answer can be followed as an example of a very good answer. However, please note that this is just one example out of many possible approaches.)
Model Answer 2:
The diagrams present data on the medical research funding for six deadly diseases in Someland as well as the deaths caused by those diseases in 1990. A glance at the charts reveals that there was a correlation between the amount spent on researching a disease and the casualties it caused- the higher funding generally produced a better result, at least for AIDS and TB.
According to the illustration, the highest medical research budget was allowed for AIDS, around 175 million and in 1990 the death count in Someland from AIDS was 0.25 million, more than death from Leprosy but fewer than fatalities caused by any other diseases. Again, the lowest research budget was for TB (roughly 25 million) and around 1.75 million people died from this illness, the highest casualties from any disease in Someland in 1990. Medical research reserves for Leprosy and Tropical Diseases were exactly the same, approximately 70 million but deaths from the later disease were noticeably higher. A similar trend could be observed in the cases of Diarrhoea and Malaria, which received around 60 and 50 million respectively for medical research and were responsible for 0.5 and 0.35 million deaths in Someland.
Model Answer 3:
The bar chart presents information on Medical research funding in Someland while the second graph shows the number of death in this area from six diseases in 1990. Overall, the highest amount of funding was allocated to research AIDS while the highest death could be observed from TB, a disease.
As is presented in the first graph, more than 400 million was funded in Someland’s Medical research and out of this approximately 175 million went on AIDS funding. Leprosy and Tropical Diseases funding amounted about 75 million each and the lowest funding was allowed for TB. Malaria and Diarrhea finding received 50 and 60 million consecutively.
The second graph shows that the highest number of death in Someland was caused by TB. It shows a relationship between the Medical research funding on a disease and the death caused by this diseases in this area. Since the lowest amount was funded for TB, the highest number of death was caused by this diseases. A very similar trend could be observed for all the other diseases and the lowest number of death was from AIDS which got the highest Medical research funding in Someland.
