You should spend about 20 minutes on this task.
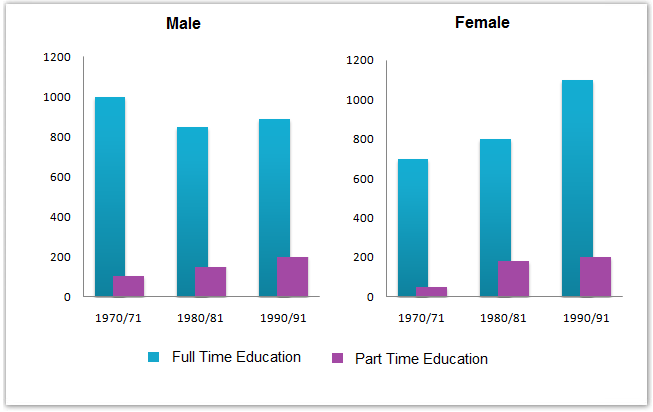
The chart below shows the number of men and women (in thousand) in further education in Britain in three periods and whether they were studying full-time or part-time. Summarise the information by selecting and reporting the main features, and make comparisons where relevant.
Write at least 150 words.
Sample Answer 1
The bar charts show data on the British people’s full-time and further part-time education from 1970 to 1991. As is presented in the graphs, more men and women were studying full-time than part-time for the given period.
Initially, in 1970 and 1971, about 1000 thousand males were in further full-time education, and this number decreased to an average of 850 thousand between 1980 and 1990. On the contrary, this number of part-time students increased over time though the number was many times lower than the number of people in full-time education. In 1970, almost 100 thousand people were in part-time education; in the next 20 years, this number increased to 200 thousand.
On the other hand, in 1970, the total number of females who were engaged in full-time education was 700 thousand, and this number increased over time and reached 11000 thousand in 1990/91, which was even higher than the number of males who were in further full-time education in this year. The number of female part-time students also increased over time and reached over 200 thousand in 1990 from the initial number of 20 thousand in 1970.
In summary, females progressed over their male counterparts in terms of their involvement in full-time and part-time education in Britain for the given period.
Sample Answer 2
The chart indicates how many men and women in Britain were enrolled in tertiary education in three periods – 1970/71, 1980/81, and 1990/91 – and whether their studies were full or part-time.
It is clear from the chart that in all periods more men and women were studying full-time than part-time. However, while the number of women studying all types of courses increased significantly over time, the number of men studying full-time decreased moderately.
Concerning part-time education, the number of men doubled over the period, rising from 100000 in 1970/71 to 200000 by 1990/91. The number of women studying this way was also around 200000, which was substantially higher than the figure of 40000 in 1970/71.
As for full-time studying, there was considerable growth in the number of women, with the figure climbing from 700000 to 1.1 million, which was the highest level in any period for any kind of studying. On the other hand, the number of men studying full-time dropped from 1 million to about 800000 between 1970/71 and 1980/81, although it rose again to 900000 in 1990/91, resulting in a decline of 100000 over the whole period.
Sample Answer 3
The bar graph indicates how men and women in Britain were enrolled in tertiary education in three periods- 1970/71,1980/81, and 1990/91 and whether their studies were full or part-time.
Overall, it can be seen that more men and women are studying full-time than part-time. However, while the number of females studying all types increased significantly over time, the number of males studying full-time decreased moderately.
While the number of male students who did full-time education fluctuated, the number of female students who did the same increased over this period. In the case of men, the figures fluctuated between 800 and 1000, whereas in the case of women, they grew from around 700 to nearly 1100 from 1970/71 to 1990/91.
In the part-time education, the male showed consistent growth in their number over the period, from approximately 100 to around 200 in the years given. In comparison, the counterparts number rose between 1970-71 and1980-81 from 50 to around 200 and this growth is seen almost arrested between 1980-81 and 1990-91.
Sample Answer 4
The bar chart illustrates how many males and females studied full-time and part-time in the following years: 1970 to 1971, 1980 to 1981 and 1990 to 1991.
It is clear that in all three periods, more people of both sexes were involved in part-time education than full-time. Overall the number of men in full-time education rose from approximately 100 thousand to 200 thousand. In contrast, the number of men in part-time education was lower in the early nineties than twenty years earlier.
As far as women are concerned, the numbers increased in both education sectors. The number of part-time female students increased dramatically from 700 thousand to 1.2 million in the twenty years. The number of women in full-time education went up gradually from 100 thousand in 1971 to just over 200 thousand in 1991. This was similar to the increase for full-time male students.
To sum up, the number of women in both sectors increased significantly while it seems that the rate of men
entering part-time education decreased a little and fluctuated.