• E-mail: admin@9ielts.com
  • Listening
    • IELTS Practice Tests
    • Recent Actual Tests
  • Reading
    • IELTS Practice Tests
    • Recent Actual Tests
  • Speaking
    • Speaking Part 1
    • Speaking Part 2
    • Speaking Part 3
  • Writing
    • General Training Writing Task 1
    • Academic Writing Task 1
      • Bar Chart
      • Line Graph
      • Pie Chart
      • Table
      • Map
      • Process Diagram
      • Mixed Charts
    • IELTS Writing Task 2
      • Advantages & Disadvantages Essays
      • Agree or Disagree Essays
      • Discuss Both Views Essays
      • Direct Questions Essays
      • Problems/Causes & Solutions Essays
  • Grammar
  • Vocabulary
    • Speaking Vocabulary
    • Writing Vocabulary
    • Collocations for IELTS
  • Books
  • Blog
No Result
View All Result
No Result
View All Result
Home IELTS Writing

Monthly household income spent on various items by two groups

9IELTS by 9IELTS
July 18, 2022
in IELTS Writing, Academic Writing Task 1, Pie Chart
Reading Time: 3 mins read
20
VIEWS

» You should spend about 20 minutes on this task.

The charts below show the percentage of monthly household income spent on various items by two different groups in one European country. Summarise the information by selecting and reporting the main features, and make comparisons where relevant.

» Write at least 150 words.

Percentage of Household income spent on different items*

HIGH-INCOME GROUP
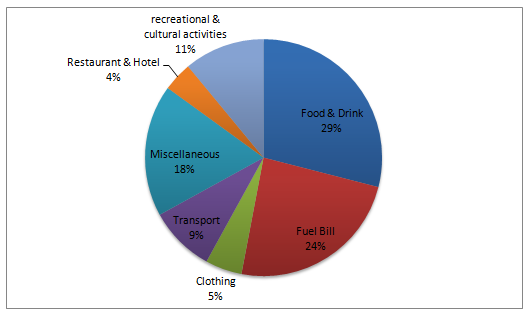
Monthly household income spent on various items by two groups.2

* Earnings Excluding House rent/ purchase

Sample Answer 1


The pie charts illustrate the proportion of household expenditure by two income groups in Europe. In general, it is clear that house rent is not included in the two pie charts.

First of all, the low-income group spends the most money on food and drink which accounted for 29% of the total income, while the high-income group spends only 15%. It is clearly shown that high-income earner spends the majority of the income on miscellaneous items (23%) whereas only 18% allocated them for the low-income earner. Those who earn less money spend more money on fuel bills than the high-income group (24% and 7% respectively). A direct link can be seen between money spent on transport and fuel bills, that is transport makes up a smaller proportion in the low-income group than high-income group (9% for the former and 16% for the latter).

Another interesting feature is that the low-income earners spend less money on recreational and cultural activities compared to the high-income group, with figures 11% and 21% respectively). For both the income groups, less money is spent on restaurant and hotel and clothing, that is 4% and 5% for low-income group and 7% and 8% for the high-income group.

[Written by – Lee Wing Qeen]

Sample Answer 2


The pie charts compare the proportion of monthly domestic cost allotted for 7 categories, namely: food and drinks, fuel bill, clothing, transport, miscellaneous, restaurant and hotel and lastly, recreational and cultural activities. The first chart illustrates the expenditures of the low-income group and the second pie chart shows how the high-income group spent their income. Both charts pertained to one of the countries in Europe.

It is evident that the low-income group spent the largest proportion of their income on food and drinks while the high-income group allotted the majority of their salary for miscellaneous items. Meanwhile, the tiniest percentage of expenditure for lesser income group was for the restaurant and hotel while for the higher income group, this was for clothing.

In detail, poor people prioritised food and drinks and this item demanded 29% of their wages unlike with rich persons, as it was only on their 4th priority with only 15%. Surprisingly, the low-income group spent more on fuel bill compared to the high-income group with 24% and 7% respectively. However, in the remaining categories, rich people had higher expenditures. For instance, rich individuals spent 21% of their wages on recreational and cultural activities while poor individuals allotted only 11% for this category. Interestingly, the high-income group spent an enormous proportion of the miscellaneous category (23%) while the low-income group allotted only 18%. Also, rich individuals spent more on transportation (16%) than poor people (9%). Similarly, both categories have less than 10% spent on clothing.

[Written by – Jehdeiah]

Previous Post

Online sales for retail sectors in New Zealand

Next Post

People naturally resist making changes in their lives

Leave a Reply Cancel reply

Your email address will not be published. Required fields are marked *

POPULAR POSTS

Cambridge IELTS 1-19 Book Series [PDF + Audio]

Cambridge IELTS 20 Academic [Update 2025]

Cambridge IELTS 19 Academic [PDF + Audio]

200 IELTS Speaking Sample Answers [PDF + Audio]

IELTS Recent Actual Tests [Full PDF + Audio]

Cambridge IELTS 18 Academic [PDF + Audio]

IELTS Listening Practice Test 204

IELTS Reading Practice Test 320

Cambridge IELTS 18 General Training [PDF + Audio]

Cambridge IELTS 17 General Training [PDF + Audio]

About Us

9ielts logo

9IELTS is dedicated to providing free materials and resources for IELTS conquerors. Stay constantly updated with a wide range of ultimate tips, strategies, and practice tests to crack the high-stakes IELTS exam!

Recent Posts

Modern buildings change the character and appearance of towns and cities

Advertising encourages consumers to buy in quantity rather than in quality

Change the dates of the visit to your friend in Australia

Direct to IELTS [PDF + Audio] Free

IELTS Reading Practice Test 19

Disclaimer

The information on this site is for informational purposes only. IELTS is a registered trademark of the University of Cambridge ESOL, the British Council, and IDP Education Australia. This site and its owners are not affiliated, approved or endorsed by University of Cambridge ESOL, the British Council, or IDP Education Australia.
  • About Us
  • Contact Us
  • Disclaimer
  • Terms & Conditions
  • Privacy Policy

© 2024 9IELTS. All Rights Reserved.

No Result
View All Result
  • Listening
    • IELTS Practice Tests
    • Recent Actual Tests
  • Reading
    • IELTS Practice Tests
    • Recent Actual Tests
  • Speaking
    • Speaking Part 1
    • Speaking Part 2
    • Speaking Part 3
  • Writing
    • General Training Writing Task 1
    • Academic Writing Task 1
      • Bar Chart
      • Line Graph
      • Pie Chart
      • Table
      • Map
      • Process Diagram
      • Mixed Charts
    • IELTS Writing Task 2
      • Advantages & Disadvantages Essays
      • Agree or Disagree Essays
      • Discuss Both Views Essays
      • Direct Questions Essays
      • Problems/Causes & Solutions Essays
  • Grammar
  • Vocabulary
    • Speaking Vocabulary
    • Writing Vocabulary
    • Collocations for IELTS
  • Books
  • Blog

© 2024 9IELTS. All Rights Reserved.