» You should spend about 20 minutes on this task.
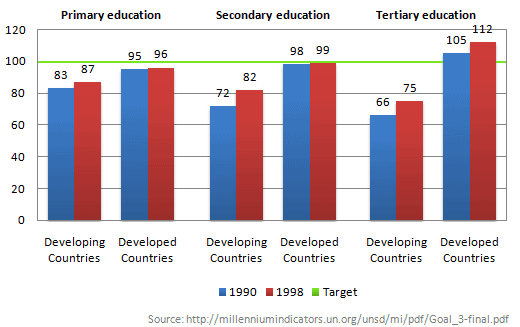
The chart below shows the number of girls per 100 boys enrolled in different levels of school education. Summarise the information by selecting and reporting the main features and make comparisons where relevant.
» Write at least 150 words.
Sample Answer 1
A glance at the graphs provided reveals the number of female students per 100 male students in three different education levels, both in poor and affluent countries, in 1990 and 2000 and its target in 2005. Overall, it is evident that female students’ number in affluent countries was higher than the poor ones.
First of all, in elementary schools in poor countries, there was a slight increase in female students from 83 pupils in 1990 to 87 pupils in 2000, while female pupils in affluent ones rose slowly to somewhere near 96 pupils in 2000. The target, furthermore, would be 100 pupils in 2005.
In addition, the poor experienced considerable growth in junior high school, with around 10 pupils. The affluent one, meanwhile, leveled off almost 100 female pupils. Whereas the target was always the same for three different education levels.
In senior high school, moreover, from a negligible 66 students in 1990, the number of female students in poor countries rapidly climbed to approximately 75 students in 2000. In affluent countries, it increased significantly more than its target, around 105 and 112 students in 1990 and 2000 respectively.
Sample Answer 2
The following bar chart illustrates three different levels of school education and the relative number of girls per 100 boys enrolled. Overall, there is a substantial difference between developing and developed countries on education level. This aspect becomes more evident compared to tertiary education.
During the 90s, the number of girls per 100 boys enrolled varied among the different levels of school education. The number of girls that attend primary school is 83 per 100 boys registered in developing countries, and this is also the peak. In developing countries, the number decreases to 66 girls per 100 boys with tertiary education level. In 1998 the situation changed not more in fact the peak is always in primary education, about 87 girls per 100 boys. These dates underline that in the developing country, the number of girls is always lower than the target.
In developed countries, the numbers completely change. There is no more difference between 1990 and 1998 compared to all the levels of education. The peak arrives with tertiary education in which it has passed the target with 105 and 112 respectively in 1990 and 1998.
Sample Answer 3
The chart shows the number of female students per 100 male students in primary, secondary and tertiary education
On Average, more boys than girls were enrolled in school both in 1990 and 1998 in all the countries, except in tertiary education in developed countries. The number of girls per 100 boys was bigger in 1998 than in 1990 in the two country groups and in all the educational stages.Turning to the detail, there were more boys than girls in primary and secondary education. As can be seen, developing countries saw a bigger discrepancy between the numbers of male and female students than developed countries, with the number of girls per 100 boys at 83 in 1990 and 87 in 1998 in primary education.
However, in developed countries, the balance of the two was much closer to the ideal, particularly in secondary education, with 98 girls per 100 boys in 1990 and 99 in 1998.Regarding tertiary education, the balance was even worse than in any other levels of education in developing countries with 66 girls enrolled for every 100 boys in 1990 and 75 in 1998. On the other hand, in developing countries, the number of girls overtook that of boys at 105 per 100 boys in 1990 and 112 in 1998.