• E-mail: [email protected]
  • Listening
    • Cambridge IELTS Tests
    • IELTS Practice Tests
    • Recent Actual Tests
  • Reading
    • Cambridge IELTS Tests
    • IELTS Practice Tests
    • Recent Actual Tests
  • Speaking
    • Speaking Part 1
    • Speaking Part 2
    • Speaking Part 3
  • Writing
    • General Training Writing Task 1
    • Academic Writing Task 1
      • Bar Chart
      • Line Graph
      • Pie Chart
      • Table
      • Map
      • Process Diagram
      • Mixed Charts
    • IELTS Writing Task 2
      • Advantages & Disadvantages Essays
      • Agree or Disagree Essays
      • Discuss Both Views Essays
      • Direct Questions Essays
      • Problems/Causes & Solutions Essays
  • Grammar
  • Vocabulary
    • Speaking Vocabulary
    • Writing Vocabulary
    • Collocation for IELTS
  • IELTS Books
  • Blog
No Result
View All Result
No Result
View All Result
Home IELTS Writing

The chart shows average levels of rainfall in Marley in the UK

9IELTS by 9IELTS
October 13, 2022
in IELTS Writing, Academic Writing Task 1, Bar Chart
Reading Time: 3 mins read
8
VIEWS

You should spend about 20 minutes on this task.

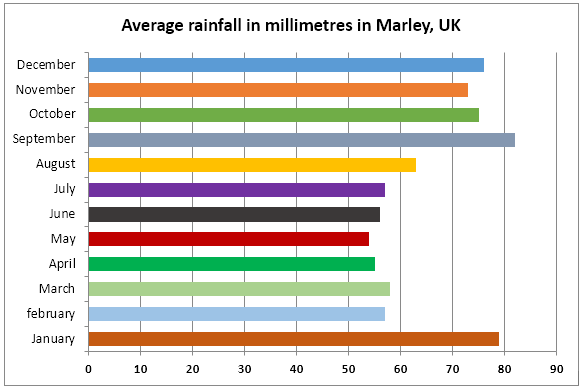
The chart shows average levels of rainfall in Marley in the UK.

The chart shows average levels of rainfall in Marley in the UK

Summarise the information by selecting and reporting the main features and make comparisons where relevant.

Write at least 150 words.

Sample Answer 1

The bar chart describes the usual amount of rain precipitate over a year in Marley, UK. It can be seen that December, September and January have the highest yearly rainfall.

From December to September, rainfall primarily increases from about 84mm to approximately 94mm. the rainfall in October has an identical amount in December by about 84mm. interestingly, the level of rainfall dramatically declines from September to May, which levels off at about 51mm.

However, this trend does not last when the rain precipitate minimally rises in April (58mm) and is followed by a moderate soar in March by approximately 64mm. In February, the figure decreases, but it is followed by a tremendous increase in January that reaches roughly 79mm.

Overall, there is a drop in rainfall in the middle of the year, yet it increases dramatically in the subsequent months.

Sample Answer 2

The chart illustrates the average amount of rain, measured in millimetres, that falls each month in Marley in the United Kingdom.

It is notable from the chart that even in the driest months, at least 50 millimetres of rain falls. The least rainfall is recorded for May, with April being next at just under 55 millimetres; June and February have approximately the same level of rain, with slightly over 55 millimetres.

Between May and August, rainfall increases by about 5 millimetres each month before increasing significantly in September. At approximately 85 millimetres, September is the wettest month, with over 5 millimetres more rain than the second wettest month January.

It is clear from the chart that the wettest part of the year is from September through to January, with the most significant variation between months being seen between January and February. Between these months, nearly 25 millimetres of rain is declining.

Sample Answer 3

The bar graph delineates Marley’s average rainfall over one year in the United Kingdom. The data has been measured in terms of millimetres.

Overall, in rainfall, September accounts for the dominant with more than 80 millimetres, while May constitutes the least, where amount of rainfall is around 55 millimetres.

It is apparent that February and March amount to an almost equivalent amount of rainfall, which is nearly 55 millimetres, followed by a marginal difference in April, June and July, where the amount of rainfall is closer to 54 millimetres for all. In addition, rainfall in September comprises about 82 millimetres, indicating the second-highest rainfall of all months, accompanied by November and October, where rainfall forms approximately 72 millimetres and 74 millimetres,s respectively. Furthermore, December makes above 70 millimetres of rainfall.

As data indicates, variation in the amount of rainfall in all respective months can be noticed.

Previous Post

Are there more advantages than disadvantages of living in a house

Next Post

Annual expenditures on cell phone and residential phone in the US

Leave a Reply

Your email address will not be published. Required fields are marked *

POPULAR POSTS

Changes that have taken place at West Park Secondary School

Explain why the movies are as popular as a means of entertainment

IELTS Listening Practice Test 60

You recently stayed in a hotel in a large city

English is becoming used more and more as a world language

Describe a special day in your country’s history

Modern technology has more negative effects on our lives than positive ones

IELTS Listening Practice Test 95

More and more people in the city live in homes with small spaces or no outdoor areas

You bought a mobile phone and it was faulty

About Us

9IELTS

9IELTS is dedicated to providing free materials and resources for IELTS conquerors. Stay constantly updated with a wide range of ultimate tips, strategies, and practice tests to crack the high-stakes IELTS exam!

Recent Posts

Shopping centre has cheap second-hand furniture

Entertainment or leisure activities should be subsidized by the government

Advantages and disadvantages of the new approach in teaching

A friend from your home country is coming to your city

Female unemployment rates in each country of the United Kingdom

Disclaimer

The information on this site is for informational purposes only. IELTS is a registered trademark of the University of Cambridge ESOL, the British Council, and IDP Education Australia. This site and its owner are not affiliated, approved or endorsed by University of Cambridge ESOL, the British Council, or IDP Education Australia.
  • About Us
  • Contact Us
  • Disclaimer
  • Terms & Conditions
  • Privacy Policy

Copyright © 2023 9IELTS. All Rights Reserved.

No Result
View All Result
  • Listening
    • Cambridge IELTS Tests
    • IELTS Practice Tests
    • Recent Actual Tests
  • Reading
    • Cambridge IELTS Tests
    • IELTS Practice Tests
    • Recent Actual Tests
  • Speaking
    • Speaking Part 1
    • Speaking Part 2
    • Speaking Part 3
  • Writing
    • General Training Writing Task 1
    • Academic Writing Task 1
      • Bar Chart
      • Line Graph
      • Pie Chart
      • Table
      • Map
      • Process Diagram
      • Mixed Charts
    • IELTS Writing Task 2
      • Advantages & Disadvantages Essays
      • Agree or Disagree Essays
      • Discuss Both Views Essays
      • Direct Questions Essays
      • Problems/Causes & Solutions Essays
  • Grammar
  • Vocabulary
    • Speaking Vocabulary
    • Writing Vocabulary
    • Collocation for IELTS
  • IELTS Books
  • Blog

Copyright © 2023 9IELTS. All Rights Reserved.

This site uses cookies to offer you a better browsing experience. By continuing to use this website, you agree to our Privacy Policy.