» You should spend about 20 minutes on this task.
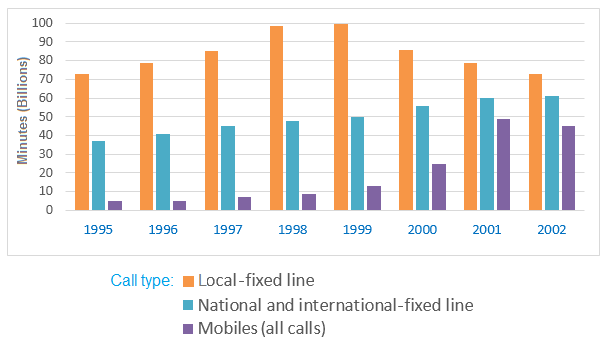
The chart below shows the total number of minutes (in billions) of telephone calls in the UK, divided into three categories, from 1995-2002.
Summarise the information by selecting and reporting the main features, and make comparisons where relevant.
» Write at least 150 words.
UK telephone calls, by category, 1995-2002
Sample Answer 1:
The bar chart outlines the duration of local, national & international and mobile phone calls in the UK between 1995 and 2002. Overall, British citizens talked over the local land-lines the most and mobile phone gained a huge popularity over the time.
Initially, in 1995, British residents talked over 70 million minutes using local-fixed lines and their conversation duration on the national and international fixed-lines was almost half of that. They spoke only 5 million minutes on cell phones. The communication span via local-fixed lines was the highest in 1999 when it accounted for 90 million minutes. At that time, their national and international landline communication amounted 50 million minutes and they talked over 10 million minutes on the cell phones. It is evident that the total number of phone conversation using the local lines increased till 1999 and then kept on declining while a steady growth was evident for national and international fixed line calls. During 2001, British people spoke around 60 million minutes on national and international land-lines while the use of mobile phone was on the hike, around 50 million minutes conversation was made by cell phones.
Sample Answer 2:
The bar chart outlines the duration of phone calls by the UK residents from 1995 to 2002. Generally speaking, most of the UK citizens made local calls during the period and the usage of cell phones rapidly increased.
According to the bar chart, initially in 1995, British talked more than 70 billion minutes on fixed-lines while 37 billion minutes were national and international fixed line calls. Only 3 billion minutes were spent by people to talk over cell phone calls. The use of local fixed-line increased steadily until 1999 when it reached to 90 billion minutes and after that, the number decreased each year and finally reached to 72 billion in 2002.
The national & international-fixed dialling increased each year and reached to 61 billion in 2002 from the initial figure of 38 billion. Finally, the number of cell phone calls expanded significantly each year which shows its increasing popularity. In 1995, the mobile phone calls were only 2 billion minutes and in 2000 it reached to approximately 25 billion minutes. Over the next 2 years, this number increased to 45 billion.
In summary, mobile phone calls gained a significant popularity among the UK callers and as of 2002, the local fixed-line calling was still the highest in the UK.
Sample Answer 3:
A glance at the bar graph reveals how many minutes (in billions) of telephone conversations were made in Britain in eight years, 1995 to 2002. Overall, the local fixed-line calls were the most popular type from 1995 to 2002 but the increasing use of cell phone in later years was noticeable.
In 1995, the local call duration was 70 billion minutes and then it steadily rose to approximately 90 billion after four years. However, the local calls span rapidly slipped to somewhere in the vicinity of 70 and 80 billion. In a stark contrast, the national and international – fixed lines and mobiles (all calls) features showed upward trends.
It is evident that the national and international fixed line calls climbed gradually from just under 40 to 60 billion in 2002. The mobiles calls, however, grew steadily in the first five years and after that witnessed a quick rise to more than 40 billion minutes.
It is interesting to note that through eight years period, the local fixed-line calls remained the highest among three call types in the United Kingdom.
[ Written by – Quynh Tran]
Sample Answer 4:
The bar chart demonstrates the duration of phone calls in the United Kingdom divided into three different types, during an eight-year period, commencing from 1995.
Looking at the details, domestic and overseas phone calls and mobile lines accounted an increase of telephone calls. Yet, the number of local calls showed a fluctuation.
The quantity of national and international call during this time in the UK was about 36 billion minutes in 1995 and swelled gradually to about 36 billion minutes in 2002, approximately twice than that of 1995. Meanwhile, mobile call showed the same trend. The number of mobile phone calls went up significantly from only about 2 billion minutes in 1995 to about 45 billion minutes in 2002 and outlined a dramatic rise, in fact, almost 28 times higher than in 1995.
In contrast, the number of local calls fluctuated over the times observed. It was about 71 billion in 1995 and rose modestly to about 90 billion minutes in 1998. The figure levelled off and began to go down in 2002 and kept on falling significantly until 2002 when the figure hit about 71 billion minutes. Nevertheless, the local fixed-line calls constituted the highest duration. The popularity of cell phone calls increased steadily over the period.
[ Written by – Linda ]
Sample Answer 5:
The bar chart illustrates annual duration of phone calls (in billion minutes) made by British people in three different categories between 1995 and 2005. In general, local fixed-line was the most popular type of telephone used by people living in the UK over the period and cell phone gained its popularity steadily.
More than 70 billion minutes were utilised by United Kingdom’s citizens to communicate each other through local fixed-line over those years and that was the highest total number of minutes talked. The use of local fixed-line reached a peak in 1999, at 90 billion minutes before falling by around 18 billion minutes in the next three years.
On the other hand, although the minutes of mobile phones were not as many as those of national and international – fixed line, this type of communication had upward trends over the time. While national and international – fixed line started roughly 38 billion minutes and then increased by approximately 22 billion at the end of the year, cell phones had about 3 billion minutes in 1995 and then rose significantly until reaching a peak to just under 50 billion in 2002.
[ Written by – Cipto Troena ]