You should spend about 20 minutes on this task.
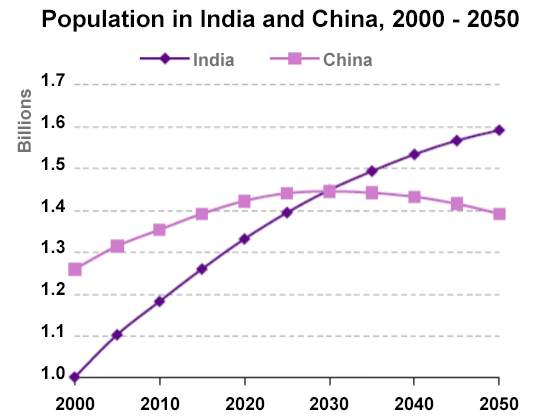
The graph below shows population figures for India and China since the year 2000 and predicted population growth up until 2050.
Summarise the information by selecting and reporting the main features, and make comparisons where relevant.
Write at least 150 words.

Sample Answer 1
The graph shows how the populations of India and China have changed since 2000 and how they will change in the future.
In 2000, more people were living in China than in India. The Chinese were 1.25 billion, while India’s population was about 1 billion. Between 2000 and 2010, there has been a 0.2 billion rise in Indian citizens. Over the same period, China’s population has increased by 0.1 billion to reach over 1.35 billion.
According to the graph, the population of India will increase more quickly than China’s, and experts say that by 2030, both countries will have the same population of 1.45 billion. After this, China’s population is likely to fall slightly to 1.4 billion in 2050, while India’s population will probably increase and reach 1.6 billion.
Thus, over the 50 years, India will experience steady population growth, and it will overtake China. On the other hand, China’s population will peak in 2030 and then begin to fall.
Sample Answer 2
This line graph shows the population count of the countries India and China from the year 2000 to 2050.
Overall, India’s population seems to be ascending steadily, whereas China’s population rate becomes stagnant after a while. The graph highlights that India and China record the same population data in the year 2030.
In 2000, China recorded around 1.25 billion people compared to India, which had 1 billion. In the next two decades, China’s population rose steadily, reaching just above 1.4 billion people in 2020, while India’s population curve showed a significant increase of around 0.4 billion.
The estimations after 2020 show that, on the one hand, China’s population will remain around 1.45 billion till 2035, after which the numbers will start falling slightly, reaching 1.4 billion by 2050. On the other hand, India’s population will rise rapidly, reaching 1.6 billion in 2050. In 2030, India and China had 1.45 billion people living in their countries.
Sample Answer 3
The two lines in the graph from the UN Population Division show the population (in billions) in China and India since 2000 and projections for the future.
From a glance, we can see that although India’s population has historically been lower than China’s, it is expected to surpass it in about 2028.
India began with a lower population than China, at 1 billion in 2000. Its steeper curve represents a faster growth rate, taking the population to its present level of 1.34 billion, about 100,000 short of China’s current population. By the period’s end, it is expected to reach 1.6 billion, a 60% increase from its starting figure.
On the other hand, China began with a population of 250,000, more significant than India’s, at 1.25 billion. Its growth rate has been slower than India’s, and the population is expected to peak in 2030, when it is about equal to that of India, at about 1.45 billion. After that, China’s population is forecast to steadily decline to 1.40 billion by the end of the period in 2050, when it will be 200,000 lower than that of India.
Sample Answer 4
The graph depicts how India’s and China’s populations have evolved since 2000 and how they will evolve in the future.
Overall, it seems inevitable that India’s population will continue to expand steadily over the next 50 years, surpassing China. On the other hand, China’s population will peak in 2030 and begin to decline.
In the year 2000, China had more people than India. China had a population of 1.25 billion people, whereas India had a population of roughly 1 billion. The number of Indian citizens increased by 0.2 billion between 2000 and 2010. China’s population has risen from 0.1 billion to over 1.35 billion in the same period.
According to the graph, India’s population will grow faster than China’s, and analysts predict that both nations will have the same population of 1.45 billion by 2030. Following this, China’s population is expected to decline slightly to 1.4 billion in 2050, while India’s population is forecast to grow to 1.6 billion.
