• E-mail: [email protected]
  • Listening
    • Cambridge IELTS Tests
    • IELTS Practice Tests
    • Recent Actual Tests
  • Reading
    • Cambridge IELTS Tests
    • IELTS Practice Tests
    • Recent Actual Tests
  • Speaking
    • Speaking Part 1
    • Speaking Part 2
    • Speaking Part 3
  • Writing
    • General Training Writing Task 1
    • Academic Writing Task 1
      • Bar Chart
      • Line Graph
      • Pie Chart
      • Table
      • Map
      • Process Diagram
      • Mixed Charts
    • IELTS Writing Task 2
      • Advantages & Disadvantages Essays
      • Agree or Disagree Essays
      • Discuss Both Views Essays
      • Direct Questions Essays
      • Problems/Causes & Solutions Essays
  • Grammar
  • Vocabulary
    • Speaking Vocabulary
    • Writing Vocabulary
    • Collocation for IELTS
  • IELTS Books
  • Blog
No Result
View All Result
No Result
View All Result
Home IELTS Writing

The reasons why people travel to work by bicycle or by car

9IELTS by 9IELTS
October 17, 2022
in IELTS Writing, Academic Writing Task 1, Pie Chart
Reading Time: 2 mins read
23
VIEWS

You should spend about 20 minutes on this task.

The charts below show the reasons why people travel to work by bicycle or by car. Summarise the information by selecting and reporting the main features, and make comparisons where relevant.

Write at least 150 words.
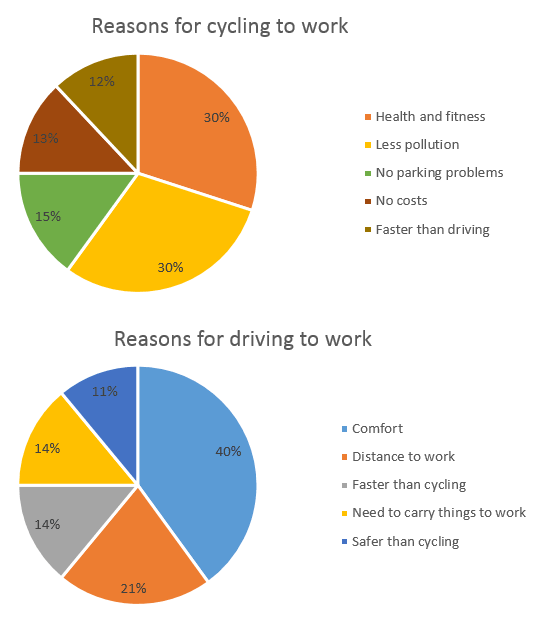
The reasons why people travel to work by bicycle or by car

Sample Answer

The first chart shows the reasons why some people in the UK prefer to cycle to work. Conversely, the second chart gives reasons for those who choose to go to work by car.

The highest percentage of those who favour cycling say that this is because riding a bicycle to work is healthier than driving. 30% of them gave this as a reason. The same amount of people, 30% say that they cycle to work because it causes less pollution. 13% of people cycle to work because it is cheaper than driving. Surprisingly, a similar amount of people said that they cycled to work because it is faster than travelling by car.

In contrast to this, the percentage who prefer to travel by car because it is more comfortable is 40%. The two least important reasons for going to work by car, with 14% and 11% respectively, is that people need to carry things to work and that it is safer than cycling to work. Finally, 16% say they prefer driving because it is faster than cycling. This contrasts with the cyclists who ride to work because it is faster than driving.

In general, it seems that the majority of people who cycle to work do this for health and environmental reasons. By contrast, those who travel by car want to have a more comfortable journey over longer distances.

(229 words)

Previous Post

The weight measurements of people living in Charlestown

Next Post

Population figures for India and China

Leave a Reply

Your email address will not be published. Required fields are marked *

POPULAR POSTS

Describe a website that you bought something from

Government should increase the cost of fuel for cars and other vehicles

Describe an ambitious person you know

IELTS Reading Practice Test 116

IELTS Reading Practice Test 108

Visitors to three London Museums between 2007 and 2012

Describe a time when you were friendly to someone you did not like

Why students are learning a foreign language

IELTS Speaking Part 3: Topic 31

Young people these days tend to be less polite and respectful than in the past

About Us

9IELTS

9IELTS is dedicated to providing free materials and resources for IELTS conquerors. Stay constantly updated with a wide range of ultimate tips, strategies, and practice tests to crack the high-stakes IELTS exam!

Recent Posts

Many old buildings protected by law are part of a nation’s history

Railway system in six cities in Europe

IELTS Vocabulary Masterclass 8.5 Book 1-3 by Marc Roche PDF

Describe someone older than you whom you admire

Nowadays it is more difficult for children to concentrate to pay attention in school

Disclaimer

The information on this site is for informational purposes only. IELTS is a registered trademark of the University of Cambridge ESOL, the British Council, and IDP Education Australia. This site and its owner are not affiliated, approved or endorsed by University of Cambridge ESOL, the British Council, or IDP Education Australia.
  • About Us
  • Contact Us
  • Disclaimer
  • Terms & Conditions
  • Privacy Policy

Copyright © 2023 9IELTS. All Rights Reserved.

No Result
View All Result
  • Listening
    • Cambridge IELTS Tests
    • IELTS Practice Tests
    • Recent Actual Tests
  • Reading
    • Cambridge IELTS Tests
    • IELTS Practice Tests
    • Recent Actual Tests
  • Speaking
    • Speaking Part 1
    • Speaking Part 2
    • Speaking Part 3
  • Writing
    • General Training Writing Task 1
    • Academic Writing Task 1
      • Bar Chart
      • Line Graph
      • Pie Chart
      • Table
      • Map
      • Process Diagram
      • Mixed Charts
    • IELTS Writing Task 2
      • Advantages & Disadvantages Essays
      • Agree or Disagree Essays
      • Discuss Both Views Essays
      • Direct Questions Essays
      • Problems/Causes & Solutions Essays
  • Grammar
  • Vocabulary
    • Speaking Vocabulary
    • Writing Vocabulary
    • Collocation for IELTS
  • IELTS Books
  • Blog

Copyright © 2023 9IELTS. All Rights Reserved.

This site uses cookies to offer you a better browsing experience. By continuing to use this website, you agree to our Privacy Policy.